Elliott Wave Theory in Forex: The Five-Wave and ABC Pattern Explained
Elliott Wave Theory proposes that markets move in predictable wave sequences driven by investor psychology. Learn the five-wave impulse pattern, three-wave correction, and the practical application and limitations of Elliott Wave in forex trading.
Elliott Wave Theory is one of the most ambitious attempts to describe financial market behavior — it proposes that price movements form recurring patterns governed by investor psychology, and that these patterns can be identified and used to forecast future price direction.
It’s also one of the most debated tools in technical analysis. When applied correctly by experienced practitioners, it provides powerful context for trend structure and potential reversals. Applied impulsively or without training, it produces endlessly flexible post-hoc explanations that don’t generate consistent trading edge.
This lesson explains the theory honestly — what it says, how it works in practice, and where its limitations lie.
The Core Concept
Ralph Nelson Elliott developed the theory in the 1930s after observing that stock market price movements appear to follow repetitive patterns related to the psychological oscillation between optimism and pessimism.
The fundamental premise: markets move in waves. Specifically, in the direction of the main trend, markets move in five waves (impulse waves). Against the main trend, markets move in three waves (corrective waves).
The Five-Wave Impulse Pattern
In a bull trend, the complete Elliott Wave cycle consists of a 5-wave motive impulse followed by a 3-wave ABC corrective phase:
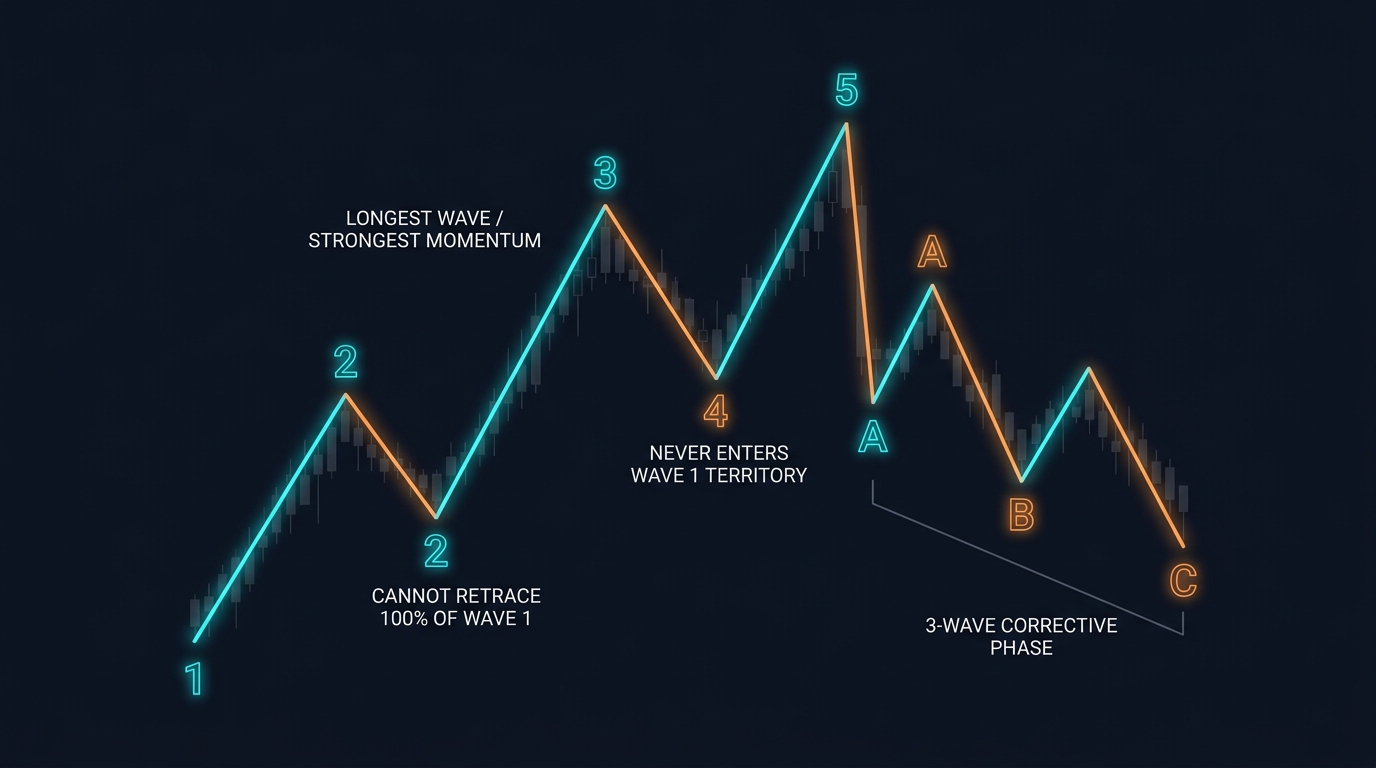
Wave 1: The initial move in the trend direction. Often unrecognized — most participants still expect the previous trend to continue.
Wave 2: A correction of Wave 1. Price pulls back but does NOT fall below Wave 1’s starting point. If it does, the count is invalid.
Wave 3: The longest and strongest wave. By this point, the new trend is recognized. Strong momentum. Wave 3 can NEVER be the shortest of waves 1, 3, and 5.
Wave 4: A second correction. Price pulls back but does NOT enter Wave 1’s price territory (in a healthy impulse). Wave 4 typically takes more time than Wave 2 to complete.
Wave 5: The final push in the trend direction. Often narrower than Wave 3, sometimes with divergence in momentum indicators (a sign of exhaustion).
Rules (Non-Negotiable)
| Rule | Description |
|---|---|
| Wave 2 cannot retrace more than 100% of Wave 1 | If it does, the count is wrong |
| Wave 3 cannot be the shortest impulse wave | Must be longer than either Wave 1 or Wave 5 |
| Wave 4 cannot enter Wave 1’s price territory | In standard conditions (some exceptions for complex waves) |
If any of these rules is violated, the wave count as labeled is incorrect — not the wave pattern itself, but your reading of where each wave starts and ends.
The Three-Wave ABC Correction
After the five-wave impulse completes, price corrects against the trend in a three-wave pattern:
Wave A: Initial move counter-trend. Many participants still expect the main trend to resume.
Wave B: A partial retracement back toward the trend direction. Often creates a false sense that the trend is resuming.
Wave C: The final corrective move, typically as long or longer than Wave A. This is where the full correction plays out.
After the ABC correction completes, the next five-wave impulse in the main trend direction begins.
Common Corrective Patterns
Elliott Wave Theory categorizes corrections into several named patterns:
| Pattern | Structure | Description |
|---|---|---|
| Zigzag | 5-3-5 (A-B-C) | Sharp correction; Wave C often extends significantly |
| Flat | 3-3-5 | Sideways correction; Wave B nearly reaches Wave A’s start |
| Triangle | 3-3-3-3-3 | Contracting or expanding triangle; typically Wave 4 or Wave B |
| Complex (WXY) | Multi-wave | Extended corrections combining multiple simpler patterns |
Fibonacci Ratios in Elliott Wave
Elliott Wave Theory is closely tied to Fibonacci ratios. Key relationships:
| Wave | Common Fibonacci Relationship |
|---|---|
| Wave 2 | Retraces 50%, 61.8%, or 78.6% of Wave 1 |
| Wave 3 | Extends to 161.8%, 200%, or 261.8% of Wave 1 |
| Wave 4 | Retraces 38.2% of Wave 3 (most common) |
| Wave 5 | Equal to Wave 1, or 61.8% of Wave 1+3 combined |
| Wave C | Equal to Wave A, or 161.8% of Wave A |
These Fibonacci ratios provide specific price targets for each wave’s completion — one of Elliott Wave’s most practically useful features.
Practical Application in Forex
The most reliable way to apply Elliott Wave is not to forecast every wave from the beginning, but to identify where you are within a clear, already-formed structure:
Highest-probability scenario: Entering Wave 3 after Wave 2 completes.
How to identify it:
- A clear Wave 1 impulse is visible on the chart (a directional move with clear structure)
- Price has pulled back in a 3-wave ABC correction that retraced 50–61.8% of Wave 1 (Wave 2)
- Momentum indicators (RSI, MACD) show bullish divergence at the Wave 2 low
- Price begins moving in the original direction again
Entry: At the end of Wave 2 (ABC correction complete) Stop: Below the Wave 1 start (if this is broken, the wave count is invalid) Target: 161.8% extension of Wave 1 from Wave 2 low (typical Wave 3 target)
The Honest Limitations
Subjectivity: Wave counting is not mechanical. Two experienced Elliott Wave practitioners can count the same chart differently. This subjectivity limits its reliability as a standalone system.
Flexibility: Because waves can be of many degrees (Grand Supercycle down to Subminuette), a wave count can almost always be reinterpreted after the fact to “explain” what happened. This makes falsification difficult.
Time horizon ambiguity: Knowing you’re in Wave 3 doesn’t tell you when Wave 3 will end. Targets and timing are probabilistic, not precise.
Best used as context, not signals: Elliott Wave is most valuable for understanding the broader structure of a move — its magnitude, its likely character (corrective vs. impulsive), and where the highest-probability opportunities may emerge. It should be combined with conventional technical analysis for actual entries and exits.
Key Takeaways
- Elliott Wave Theory proposes markets move in 5-wave impulse sequences (in the trend direction) followed by 3-wave ABC corrections (against the trend)
- Three non-negotiable rules: Wave 2 cannot fully retrace Wave 1; Wave 3 cannot be the shortest impulse; Wave 4 cannot enter Wave 1’s territory
- Fibonacci ratios are central: Wave 2 typically retraces 50–61.8% of Wave 1; Wave 3 targets 161.8% extension
- The highest-probability trade: entering Wave 3 after Wave 2 (ABC correction) is confirmed complete
- Elliott Wave is most useful as contextual framework combined with conventional technical analysis — not as a standalone signal generator
- Its primary limitation is subjectivity in wave counting; use only after studying multiple real market examples, not from theoretical descriptions alone
Next: Five-Wave Pattern | Three-Wave ABC Pattern
Related lessons: Fibonacci Retracement | Head and Shoulders

Ready to Practice This Strategy?
Test what you learned on a free, risk-free demo account before risking real money.