Alpha
Alpha is a quantitative metric representing the excess return of an investment portfolio relative to a benchmark index, calculated after adjusting for market risk through the Capital Asset Pricing Model (CAPM).
What Is Alpha?
Alpha ($\alpha$) measures an investment portfolio’s active return against a benchmark index on a risk-adjusted basis. In modern portfolio theory, market performance that can be captured simply by holding a broad index fund is classified as beta ($\beta$), or systematic market exposure. Alpha represents the value added or subtracted by an active portfolio manager through security selection, asset allocation, opportunistic hedging, or quantitative trading algorithms.
A positive alpha of $+2.5%$ indicates that the portfolio manager outperformed the benchmark by 250 basis points over the evaluation window after accounting for the volatility and systematic risk assumed. A negative alpha signifies underperformance, demonstrating that the fund generated returns lower than what its underlying risk profile warranted.
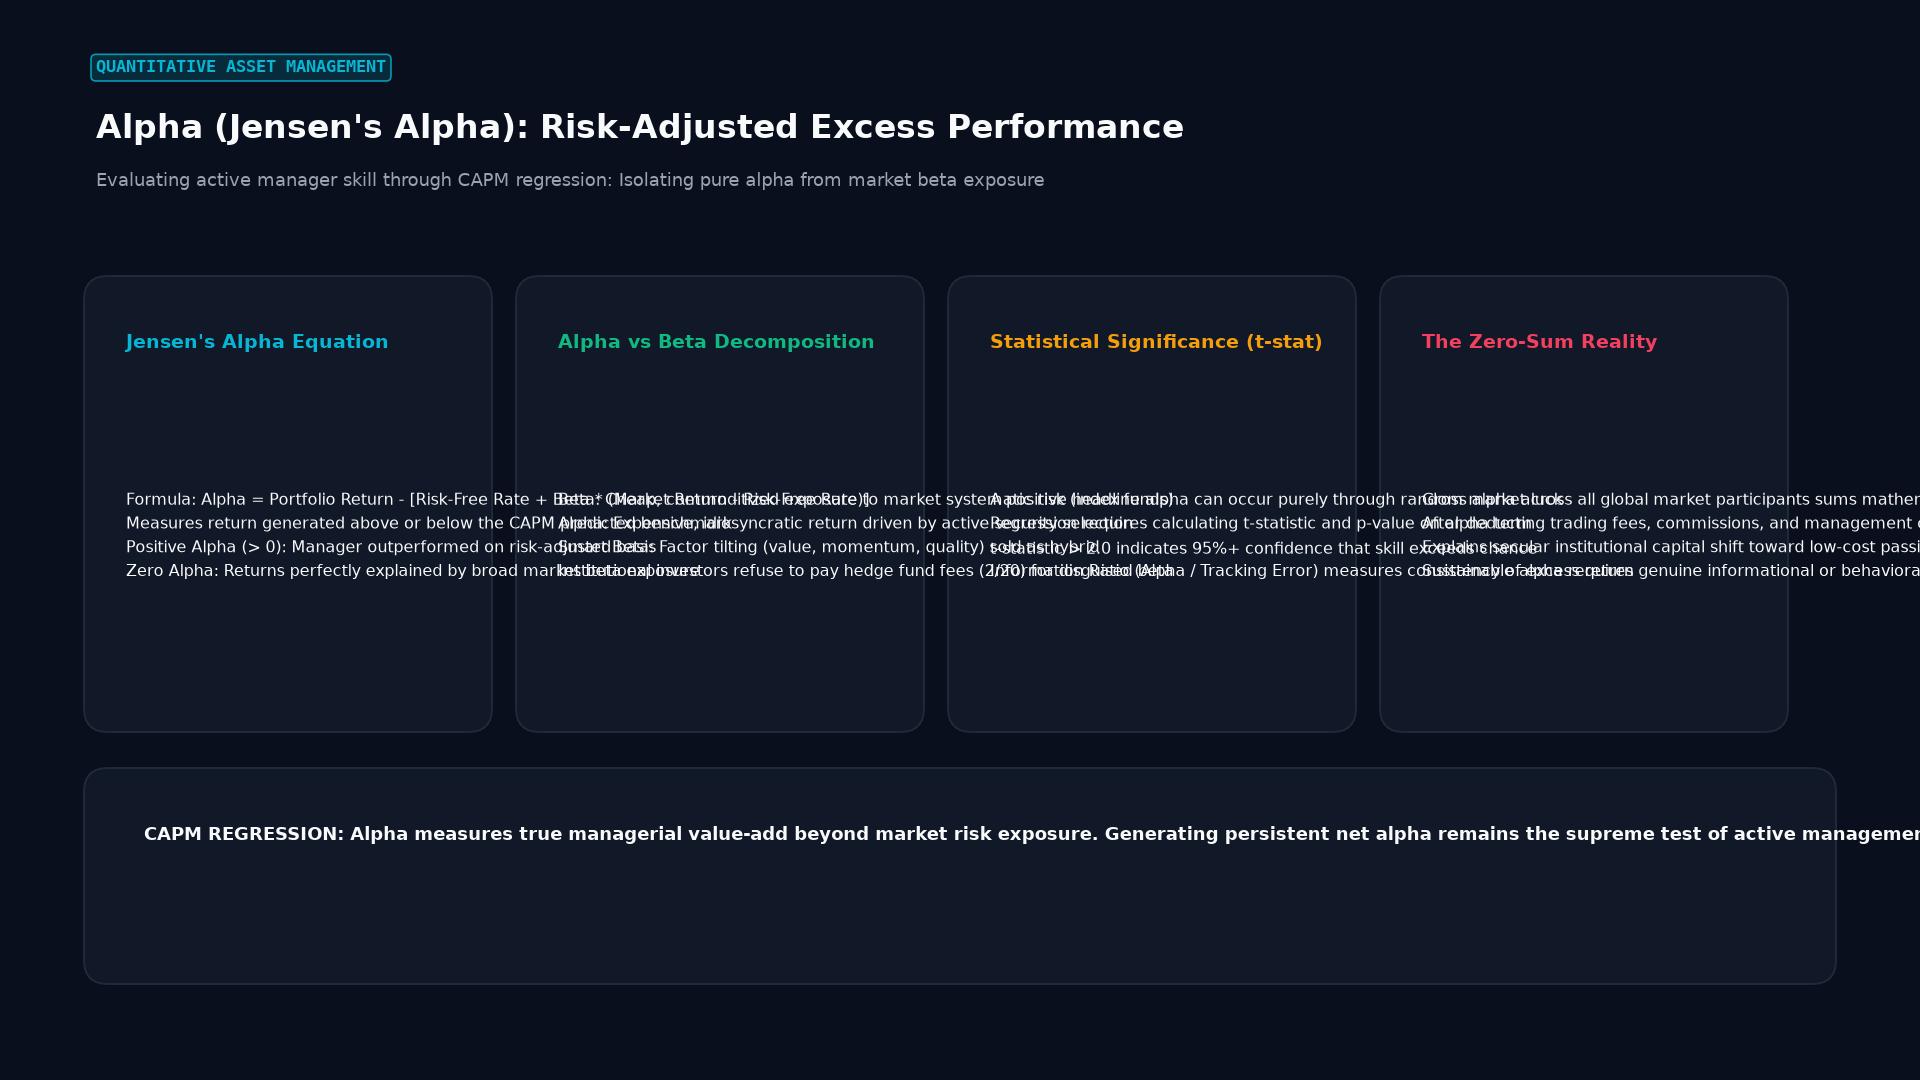 Figure: Evaluating active manager skill through CAPM regression: Isolating pure alpha from market beta exposure
Jensen’s Alpha Formula and Mathematical Derivation
Formulated by economist Michael Jensen in 1968, Jensen’s Alpha evaluates mutual fund manager performance using the Capital Asset Pricing Model (CAPM). It isolates pure manager skill by subtracting the portfolio’s expected return from its actual realized return:
$$\alpha = R_p - \left[ R_f + \beta_p (R_m - R_f) \right]$$
Where:
- $R_p$ = Realized return of the portfolio.
- $R_f$ = Risk-free rate of return (such as short-term US Treasury Bills).
- $\beta_p$ = Systematic risk coefficient (beta) of the portfolio relative to the benchmark.
- $R_m$ = Realized return of the market benchmark index (such as the S&P 500 or MSCI World).
- $R_m - R_f$ = Market risk premium.
Step-by-Step Calculation Example
Suppose an equity hedge fund delivers an annual return of $16.0%$. During the same period:
- The risk-free rate ($R_f$) is $4.0%$.
- The S&P 500 benchmark ($R_m$) returns $11.0%$.
- The fund’s calculated portfolio beta ($\beta_p$) is $1.30$, reflecting higher volatility than the broader market.
-
Calculate the expected CAPM return: $$\text{Expected Return} = 4.0% + 1.30 \times (11.0% - 4.0%) = 4.0% + 1.30 \times 7.0% = 13.1%$$
-
Calculate Jensen’s Alpha: $$\alpha = 16.0% - 13.1% = +2.9%$$
Although the fund beat the index by $5.0%$ in raw nominal terms ($16.0% - 11.0%$), its risk-adjusted alpha is $+2.9%$ because the fund took on $30%$ more systematic volatility than the market index.
Alpha vs. Beta: Core Structural Differences
Understanding the operational boundary between alpha and beta determines how institutional allocators assign capital and negotiate fee schedules.
| Metric Attribute | Alpha ($\alpha$) | Beta ($\beta$) |
|---|---|---|
| Primary Definition | Uncorrelated excess return generated by active decisions | Co-movement and sensitivity to broad market fluctuations |
| Source | Security selection, market timing, private information, arbitrage | Passive capital allocation, systemic economic growth |
| Replication Difficulty | High; scarce, perishable, and zero-sum across market participants | Low; replicated via low-cost ETFs and index futures |
| Institutional Fee Level | Premium (1% to 2% management fee plus 15% to 20% performance fee) | Commodity (0.03% to 0.15% expense ratios) |
| Persistence | Decays over time as competitors identify and arbitrage anomalies | Structural; persists as long as the underlying asset class exists |
| Risk Character | Idiosyncratic (unsystematic) firm-specific or asset-specific risk | Systematic market risk that cannot be eliminated by diversification |
Multi-Factor Models: Fama-French and Carhart Alpha
In modern quantitative finance, single-factor Jensen’s alpha is often considered insufficient. Many historical sources of alpha were revealed to be disguised factor exposures. If a manager delivers outperformance simply by buying small-cap value stocks, institutional allocators classify that return as smart beta rather than true alpha.
The Fama-French Three-Factor Model decomposes performance across size and value premiums:
$$R_p - R_f = \alpha + \beta_1 (R_m - R_f) + \beta_2 \text{SMB} + \beta_3 \text{HML} + \epsilon$$
Where:
- SMB (Small Minus Big): Return premium generated by small-cap equities over large caps.
- HML (High Minus Low): Return premium of high book-to-market value equities over growth stocks.
The Carhart Four-Factor Model adds a momentum factor (UMD, Up Minus Down). A manager possesses genuine alpha only if their residual constant $\alpha$ remains statistically positive after controlling for all known systematic factor anomalies.
       THE ALPHA FACTOR EVAPORATION FUNNEL
+----------------------------------------------------+
|  Gross Nominal Outperformance                      |
+----------------------------------------------------+
           |  (Subtract Beta: Market CAPM)
           v
+----------------------------------------------------+
|  Jensen's Single-Factor Alpha                      |
+----------------------------------------------------+
           |  (Subtract Smart Beta: Size, Value, Momentum)
           v
+----------------------------------------------------+
|  Multi-Factor Residual Alpha                       |
+----------------------------------------------------+
           |  (Subtract Execution Costs, Slippage, Fees)
           v
+----------------------------------------------------+
|  True Net Economic Alpha (Pure Manager Edge)       |
+----------------------------------------------------+
Alpha in Currency and Derivatives Trading
In foreign exchange (FX) and derivatives markets, generating alpha differs from long-only equity portfolios. Because global currencies trade in pairs and sum to zero in relative valuation, FX markets do not have a natural long-term equity risk premium.
Traders extract alpha in currency markets through:
- Discretionary Macro Positioning: Anticipating central bank interest rate divergences, shift in terms of trade, and geopolitical developments.
- Systematic Carry Strategies: Going long high-yielding currencies while shorting low-yielding funding currencies, dynamically hedging tail risk when volatility surges.
- Statistical Arbitrage and Volatility Surfaces: Exploiting mispricings between implied volatility in OTC currency options and realized underlying spot volatility.
- Order Flow Microstructure: Using colocation, direct market data feeds, and limit order book queues to harvest liquidity rebates and capture microscopic spreads.
Portable Alpha Strategies
Institutional pension funds frequently use portable alpha frameworks. A fund manager achieves desired beta exposure by purchasing index futures or interest rate swaps, which requires posting only a modest margin deposit.
The remaining balance of cash is deployed into an uncorrelated absolute-return hedge fund strategy. If the hedge fund generates $+4%$ alpha, that outperformance is added directly on top of the synthetic index return, separating the beta allocation from the alpha generator.
Risks, Alpha Decay, and Implementation Challenges
Achieving persistent alpha faces several structural headwinds:
- Alpha Decay: Profitable trading edges attract competing capital. As quantitative algorithms identify the same statistical anomalies, prices adjust faster, squeezing profit margins and shrinking the half-life of trading signals.
- Capacity Constraints: An edge that generates $+15%$ annual alpha on a $20 million capital base frequently collapses when deployed across $2 billion. Market impact, liquidity limits, and bid-ask slippage consume the performance advantage.
- Survivorship Bias: Public performance league tables display surviving funds while concealing hundreds of closed or liquidated funds that failed to produce alpha, distorting industry averages.
- Fee Drag: High management and incentive fees often capture the entirety of gross alpha, leaving investors with net returns comparable or inferior to passive index benchmarks.
Frequently Asked Questions
What is the difference between positive alpha and high returns?
High absolute returns do not necessarily mean high alpha. A portfolio can gain $25%$ during a massive bull market simply because it holds high-beta stocks. If the benchmark gained $30%$ during the same period, the manager produced negative alpha despite the attractive nominal profit.
Can an individual retail trader generate alpha?
Yes, retail traders can capture alpha in niche, illiquid, or neglected market sectors where institutional funds cannot operate due to size constraints. Examples include micro-cap stocks, regional debt, and exotic currency crosses. However, retail traders face higher relative execution costs and asymmetric information.
What is the relationship between alpha and the Sharpe ratio?
Alpha measures the excess percentage return of a portfolio relative to an index benchmark adjusted for market risk. The Sharpe ratio measures total portfolio excess return per unit of total risk (standard deviation). Alpha evaluates active manager skill against a benchmark, while the Sharpe ratio assesses overall risk efficiency regardless of benchmark composition.
Ready to trade forex?
Open a free demo account with a regulated broker. Practice with virtual funds before risking real money.