Carry Trade Strategy: How It Works in 2026 and When to Use It
The carry trade is one of forex's oldest strategies. Learn how interest rate differentials generate income, which pairs to use in 2026, entry/exit rules, and the risks that have blindsided thousands of traders.
The carry trade doesn’t care about candlestick patterns, RSI levels, or Elliott Wave counts. It generates income from a fundamental economic reality: different central banks set different interest rates, and that differential can be harvested as daily income simply by holding the right currency pair overnight.
It sounds almost too simple. In calm markets, it often works exactly as advertised. In crisis periods, it unwinds with a speed that catches even experienced traders completely flat-footed.
This lesson explains how the carry trade works mechanically, which pairs are relevant in 2026, the specific conditions under which it performs, and the risk management discipline you need to avoid the blow-ups that have defined its history.
How the Carry Trade Works
When you hold a forex position overnight, your broker either charges you or pays you rollover interest (also called swap). The direction depends on which currency in the pair has the higher interest rate.
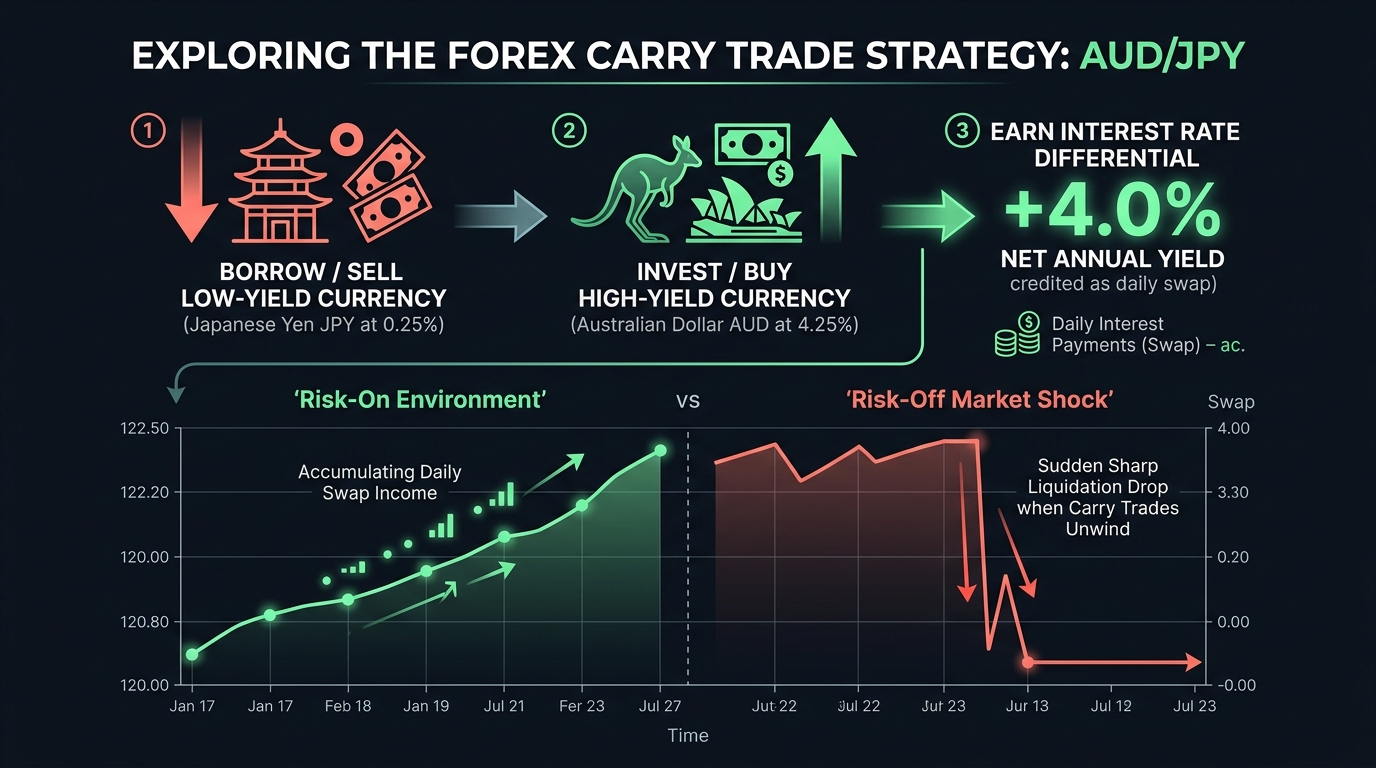
If you buy a currency with a high interest rate (e.g., Australian Dollar at 4.25%) and sell a currency with a low interest rate (e.g., Japanese Yen at 0.10%), the interest rate differential is approximately 4.15% annualized. Your broker pays you a fraction of that differential for every day the position remains open.
The mechanics:
- Buy the high-rate currency / Sell the low-rate currency
- Hold the position — sometimes for weeks, months, or years
- Collect daily swap credits as passive income
- Profit (or lose) from price movement in addition to the swap income
The carry trade thesis is that the swap income acts as a buffer against adverse price movement, and that high-yield currencies tend to appreciate against low-yield ones over medium-term periods when the global economy is expanding.
Current Interest Rate Landscape (2026)
Interest rate environments change significantly. The pairs used for carry trades in 2009 are not necessarily the best ones in 2026.
| Currency | Central Bank | Benchmark Rate (Sep 2026, approx.) |
|---|---|---|
| USD | Federal Reserve | 4.75% |
| EUR | European Central Bank | 3.25% |
| GBP | Bank of England | 4.50% |
| AUD | Reserve Bank of Australia | 4.25% |
| NZD | Reserve Bank of New Zealand | 4.00% |
| CAD | Bank of Canada | 3.75% |
| JPY | Bank of Japan | 0.25% |
| CHF | Swiss National Bank | 1.25% |
Note: These are approximate reference rates. Always verify current rates at your broker before executing a carry trade, as swap rates vary by instrument and may differ from benchmark rates.
High-potential carry pairs in 2026 (based on differential):
| Pair | Long Side Rate | Short Side Rate | Approximate Annual Differential |
|---|---|---|---|
| AUD/JPY | AUD 4.25% | JPY 0.25% | ~4.0% |
| GBP/JPY | GBP 4.50% | JPY 0.25% | ~4.25% |
| USD/JPY | USD 4.75% | JPY 0.25% | ~4.5% |
| NZD/JPY | NZD 4.00% | JPY 0.25% | ~3.75% |
| GBP/CHF | GBP 4.50% | CHF 1.25% | ~3.25% |
A key difference from the 2009–2015 era: the Fed and other major central banks are no longer at zero. The JPY remains at historically low rates, so JPY crosses remain the most attractive carry vehicles. But USD-funded carry trades now compete with simply holding US assets.
Entry and Exit Rules
Entry Conditions
| Rule | Requirement |
|---|---|
| Macro environment | Risk-on: equity markets trending upward, VIX below 20, no major geopolitical crises |
| Interest rate trend | High-yield central bank is not actively cutting rates |
| Technical confirmation | Price is in an established uptrend on the daily chart (for long carry trades) |
| Economic calendar | No central bank meeting within 2 weeks that could alter the rate differential |
| Momentum | Weekly RSI above 50 on the pair confirms trend health |
Position Management
| Parameter | Recommendation |
|---|---|
| Position size | Smaller than typical directional trades (0.5–1% risk) — you hold longer |
| Initial stop-loss | Below key daily/weekly support (structure-based, not fixed pips) |
| Take-profit | No fixed TP — manage dynamically; exit on macro shift |
| Hold duration | Days to months depending on environment |
| Leverage | Low: 5:1 to 15:1 maximum |
Exit Signals
Close the carry trade when any of the following occur:
- The high-yield central bank cuts rates (differential narrows)
- Global risk sentiment shifts sharply negative (VIX spikes above 30)
- The pair breaks below a major weekly support level
- Equity markets fall more than 10% from recent highs
- Geopolitical events create significant uncertainty in the high-yield currency’s economy
The 2008 and 2015 Unwinds: What History Teaches
The carry trade has a dangerous characteristic: it tends to build quietly over months and unwind violently in days.
2008–2009: During the global financial crisis, the AUD/JPY pair dropped from approximately 104 to 55 in roughly six months. Traders who had been collecting swap for years gave it all back in a matter of weeks. The psychological difficulty was compounded by the fact that the pair had been rising for so long that many traders believed the yen was permanently weak.
2015: The Swiss National Bank unexpectedly removed its CHF/EUR peg in January 2015. CHF strengthened 20–30% against most major currencies within minutes. Carry trades funded in CHF were obliterated before stops could execute.
2024: The Bank of Japan’s surprise rate hike in July 2024 triggered a rapid unwinding of JPY carry trades. The Nikkei fell 12% in a single day. AUD/JPY dropped over 700 pips within days.
The pattern is consistent: carry trades are profitable in calm conditions and catastrophic in crises. You need explicit rules for when to exit before the unwind is apparent.
Carry Trade vs. Directional Trading
| Aspect | Carry Trade | Directional Trade |
|---|---|---|
| Primary profit source | Interest differential | Price movement |
| Typical hold duration | Days to months | Minutes to days |
| Win rate | High (when conditions are right) | Variable by strategy |
| Risk profile | Low in calm markets, severe in crises | Consistent, defined by SL |
| Leverage needed | Low | Moderate |
| Required monitoring | Weekly or monthly | Active |
| Best market condition | Low volatility, risk-on | Trending markets |
Risk Management for Carry Trades
Because carry trades are held for extended periods and the thesis is macroeconomic rather than technical, the risk management approach differs from intraday trading:
Position sizing: Use 0.5–1% risk per trade. The swap income doesn’t justify oversizing.
Stop-loss: Must be structure-based on the weekly or monthly chart, not based on a fixed number of pips. Tight stops get triggered by normal volatility before the setup plays out.
Portfolio exposure: Avoid putting more than 5–8% of total account capital across all open carry trades simultaneously. Carry trades are correlated — they all unwind together in a crisis.
The volatility trigger: Define in advance what VIX level or equity market drawdown will force you to close all carry positions. Stick to that rule. The traders who lose big on carry unwinds are the ones who held on hoping it would reverse.
Rollover rates: Check your broker’s actual swap rates before entering. Swap rates vary significantly between brokers and may not match the theoretical interest differential. Some brokers charge commissions that eliminate most of the swap income on smaller accounts.
Calculating the Daily Carry Income
To estimate the daily swap income for a carry trade position:
Daily Swap = (Interest Rate Differential / 365) × Position Size in Base Units

Example: AUD/JPY long, 1 standard lot (100,000 AUD), 4.0% differential
Daily Swap ≈ (0.04 / 365) × 100,000 = ~$10.96 per day (in AUD terms)
Over a 30-day hold, that’s approximately $329 in swap income. Against a $10,000 account at 1% risk ($100), the math is attractive — but only if the position doesn’t move adversely.
Use the pip calculator to verify pip values and the margin calculator to confirm you have adequate margin before sizing the position.
Key Takeaways
- The carry trade profits from interest rate differentials by holding a high-yield currency vs. a low-yield one overnight
- In 2026, JPY-crosses (AUD/JPY, USD/JPY, GBP/JPY) offer the most attractive differentials due to the Bank of Japan’s continued near-zero rates
- The strategy works best in risk-on environments with low VIX and rising equity markets — and fails violently in crises
- Position sizing must be conservative (0.5–1% risk) because you hold longer and the unwind can be rapid
- Pre-define your exit triggers before entering: a specific VIX level, an equity market drawdown, or a central bank rate cut signal
- Always verify actual broker swap rates — they differ from theoretical rates and may significantly change the economics
Related strategies: News Trading | Moving Averages Crossover
Related tools: Position Size Calculator | Pip Value Calculator
Risk Disclosure & Testing
Past performance of any trading strategy is not indicative of future results. Always backtest and forward test this strategy on a free demo account before committing real financial capital.

Practice This Strategy on a Live Demo
Choose an ECN broker with tight spreads and fast execution for strategy backtesting.