American Association of Individual Investors (AAII)
The American Association of Individual Investors (AAII) is a nonprofit educational organization founded in 1978, renowned in global markets for its weekly Sentiment Survey, a benchmark contrarian indicator measuring retail investor market outlook.
What Is the American Association of Individual Investors (AAII)?
The American Association of Individual Investors (AAII) is a nonprofit educational organization founded in 1978 by Dr. James Cloonan. Operating under section 501(c)(3) of the Internal Revenue Code, AAII provides retail investors with unbiased financial education, asset allocation research, and empirical stock screening methodologies without commercial product endorsements or brokerage affiliations.
In global financial markets and institutional trading desks, AAII is best known for the AAII Sentiment Survey. Conducted continuously since July 1987, this weekly poll measures retail investor expectations for the stock market over the coming six months. Because retail investors frequently exhibit pro-cyclical emotional extremes, buying aggressively at market tops and capitulating at cycle bottoms, professional traders utilize the survey as a prominent contrarian market indicator.
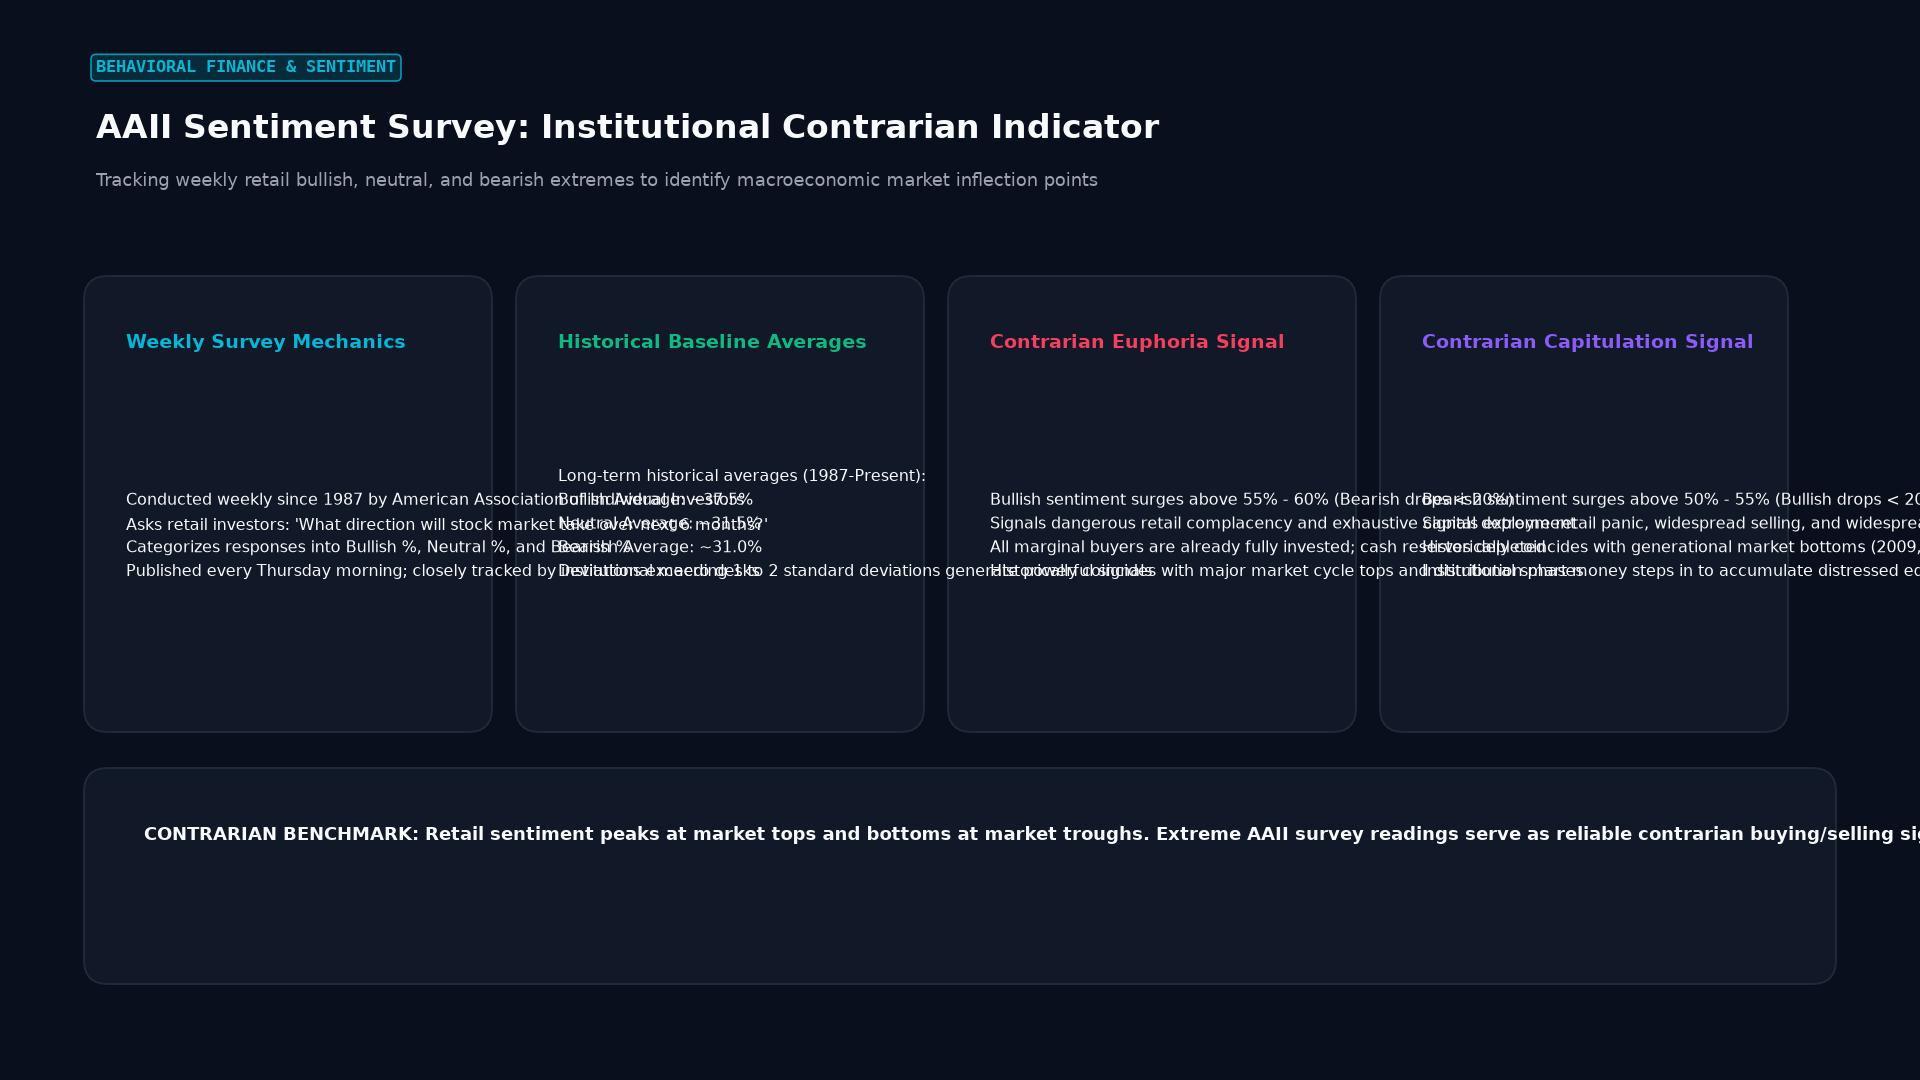 Figure: Tracking weekly retail bullish, neutral, and bearish extremes to identify macroeconomic market inflection points
The AAII Sentiment Survey: Mechanics and Historical Benchmarks
Every week, AAII polls its membership with a straightforward question: “What direction do you feel the stock market will be in for the next 6 months?” Respondents select one of three stances:
- Bullish (Prices will rise)
- Neutral (Prices will remain largely unchanged)
- Bearish (Prices will decline)
Results are compiled every Wednesday at midnight and publicly released on Thursday mornings.
Historical Baseline Averages (1987–Present)
To interpret the weekly survey data, analysts benchmark readings against long-term historical norms:
| Sentiment Stance | Historical Long-Term Average | Typical Range | Extreme Territory (Contrarian Trigger) |
|---|---|---|---|
| Bullish | 37.5% | 30.0% – 45.0% | Greater than 55.0% (Excessive Greed) |
| Neutral | 31.5% | 25.0% – 38.0% | Greater than 45.0% (Indecision / Low Conviction) |
| Bearish | 31.0% | 22.0% – 40.0% | Greater than 50.0% (Extreme Fear / Capitulation) |
The Bull-Bear Spread
Quantitative desks track the Bull-Bear Spread, calculated as:
$$\text{Bull-Bear Spread} = \text{Bullish %} - \text{Bearish %}$$
A Bull-Bear Spread exceeding $+35$ reflects widespread retail optimism, often preceding market consolidations or corrective drawdowns. Conversely, readings plunging below $-30$ indicate pervasive pessimism, historically coinciding with major intermediate and cyclical market bottoms, such as in March 2009 (bearishness at 70.3%) and October 2022 (bearishness exceeding 60%).
AAII Asset Allocation Survey
In addition to market sentiment, AAII conducts a monthly Asset Allocation Survey tracking the actual portfolio exposure of its members across three primary asset classes:
              AAII MONTHLY PORTFOLIO EXPOSURE COMPOSITION
+---------------------------------------------------------------+
|  Stocks / Equity Funds (Historical Benchmark: ~60% - 65%)     |
+------------------------------------+--------------------------+
|  Bonds & Fixed Income (~15% - 20%) |  Cash Reserves (~15%)    |
+------------------------------------+--------------------------+
This survey measures what retail investors are actually doing with their capital, rather than what they merely feel:
- Cash Allocations Above 25%: Reflects defensive capital hoarding, creating significant dry powder that can fuel subsequent liquidity-driven equity rallies.
- Cash Allocations Below 12%: Signals that retail accounts are fully invested, indicating limited incremental retail buying power left to sustain upward momentum.
Academic Research and Fundamental Screening Models
Beyond market sentiment polling, AAII has contributed substantial research to quantitative factor investing and small-cap anomalies:
1. The Model Shadow Stock Portfolio
Developed by Dr. Cloonan in 1993, this empirical portfolio demonstrates the long-term outperformance of micro-cap value equities. The strategy systematically targets companies with:
- Market capitalizations between $30 million and $300 million.
- Price-to-Book (P/B) ratios in the lowest decile of public equities.
- Two consecutive quarters of positive operating earnings.
2. Factor and Fundamental Screening Engines
AAII tracks and backtests more than 60 systematic investment methodologies derived from legendary investors (including Benjamin Graham, Peter Lynch, John Neff, and William O’Neil’s CAN SLIM). These screens provide independent data on the performance of value, growth, momentum, and earnings revision factors across varying economic cycles.
Cross-Asset and Forex Transmission
While the AAII Sentiment Survey directly questions US stock market expectations, currency and macro traders monitor the data for global risk appetite shifts:
- Risk-On Dynamics: Extreme bearish sentiment reversals (where bearishness drops rapidly while bullishness surges) typically correlate with global “risk-on” capital flows. During these phases, high-beta commodity currencies (such as the Australian dollar, New Zealand dollar, and emerging market currencies) tend to appreciate against traditional safe havens.
- Safe-Haven Bid: Sustained spikes in AAII bearishness above 50% often coincide with institutional flight to safety, driving capital into the US Dollar Index (DXY), Japanese yen, and short-term US Treasury bills.
Limitations and Practical Pitfalls
- Demographic Skew: AAII’s paid membership skews older, more affluent, and more self-directed than the average retail participant. As a result, the survey captures the views of experienced individual investors rather than the fast-moving speculative retail crowd trading options via mobile fintech apps.
- False Timing Signals: In persistent structural bull markets, retail sentiment can remain “excessively bullish” for months without triggering a price decline. Using sentiment extremes as an isolated timing trigger for short positions frequently leads to severe losses.
- Survey Volatility: Weekly data points can swing erratically in response to sensationalist financial headlines. Institutional analysts avoid single-week readings, relying instead on 4-week or 8-week moving averages to filter out transient noise.
Frequently Asked Questions
Why is the AAII Sentiment Survey considered a contrarian indicator?
When the vast majority of retail participants have turned bullish, they have already deployed their available capital into equities. With few marginal buyers remaining, upside momentum stalls. Conversely, when bearish sentiment reaches extremes, retail selling pressure is exhausted, leaving the market primed for sharp recoveries on any neutral or positive news.
What is the difference between AAII and the Investors Intelligence survey?
The AAII Sentiment Survey questions individual retail investors directly about their 6-month market expectations. In contrast, the Investors Intelligence Sentiment Survey analyzes published market newsletters and professional advisory services, measuring the sentiment of independent professional market forecasters rather than individual retail traders.
How often are AAII Sentiment Survey results published?
The survey results are published every Thursday morning at 06:00 AM Eastern Time, reflecting polling responses submitted by active AAII members over the preceding seven-day period ending Wednesday night.
Ready to trade forex?
Open a free demo account with a regulated broker. Practice with virtual funds before risking real money.