Analyse
To analyse is the methodical process of evaluating financial statements, economic indicators, and market pricing structures to determine asset valuation, assess business risk, and formulate capital allocation decisions.
What Does It Mean to Analyse Financial Markets?
To analyse (the standard Commonwealth English spelling of the American analyze) is the disciplined practice of deconstructing complex financial data, corporate statements, and economic indicators into component elements to evaluate the intrinsic value, risk profile, and future performance trajectory of a financial asset. In capital markets, rigorous financial analysis forms the basis for equity research ratings, credit underwriting decisions, macroeconomic forecasting, and quantitative algorithmic trading.
Institutional market participants conduct analysis through two overarching frameworks: Top-Down Analysis, which flows from global macroeconomic conditions down to individual asset selection, and Bottom-Up Analysis, which isolates company-specific fundamental metrics regardless of broader economic headwinds.
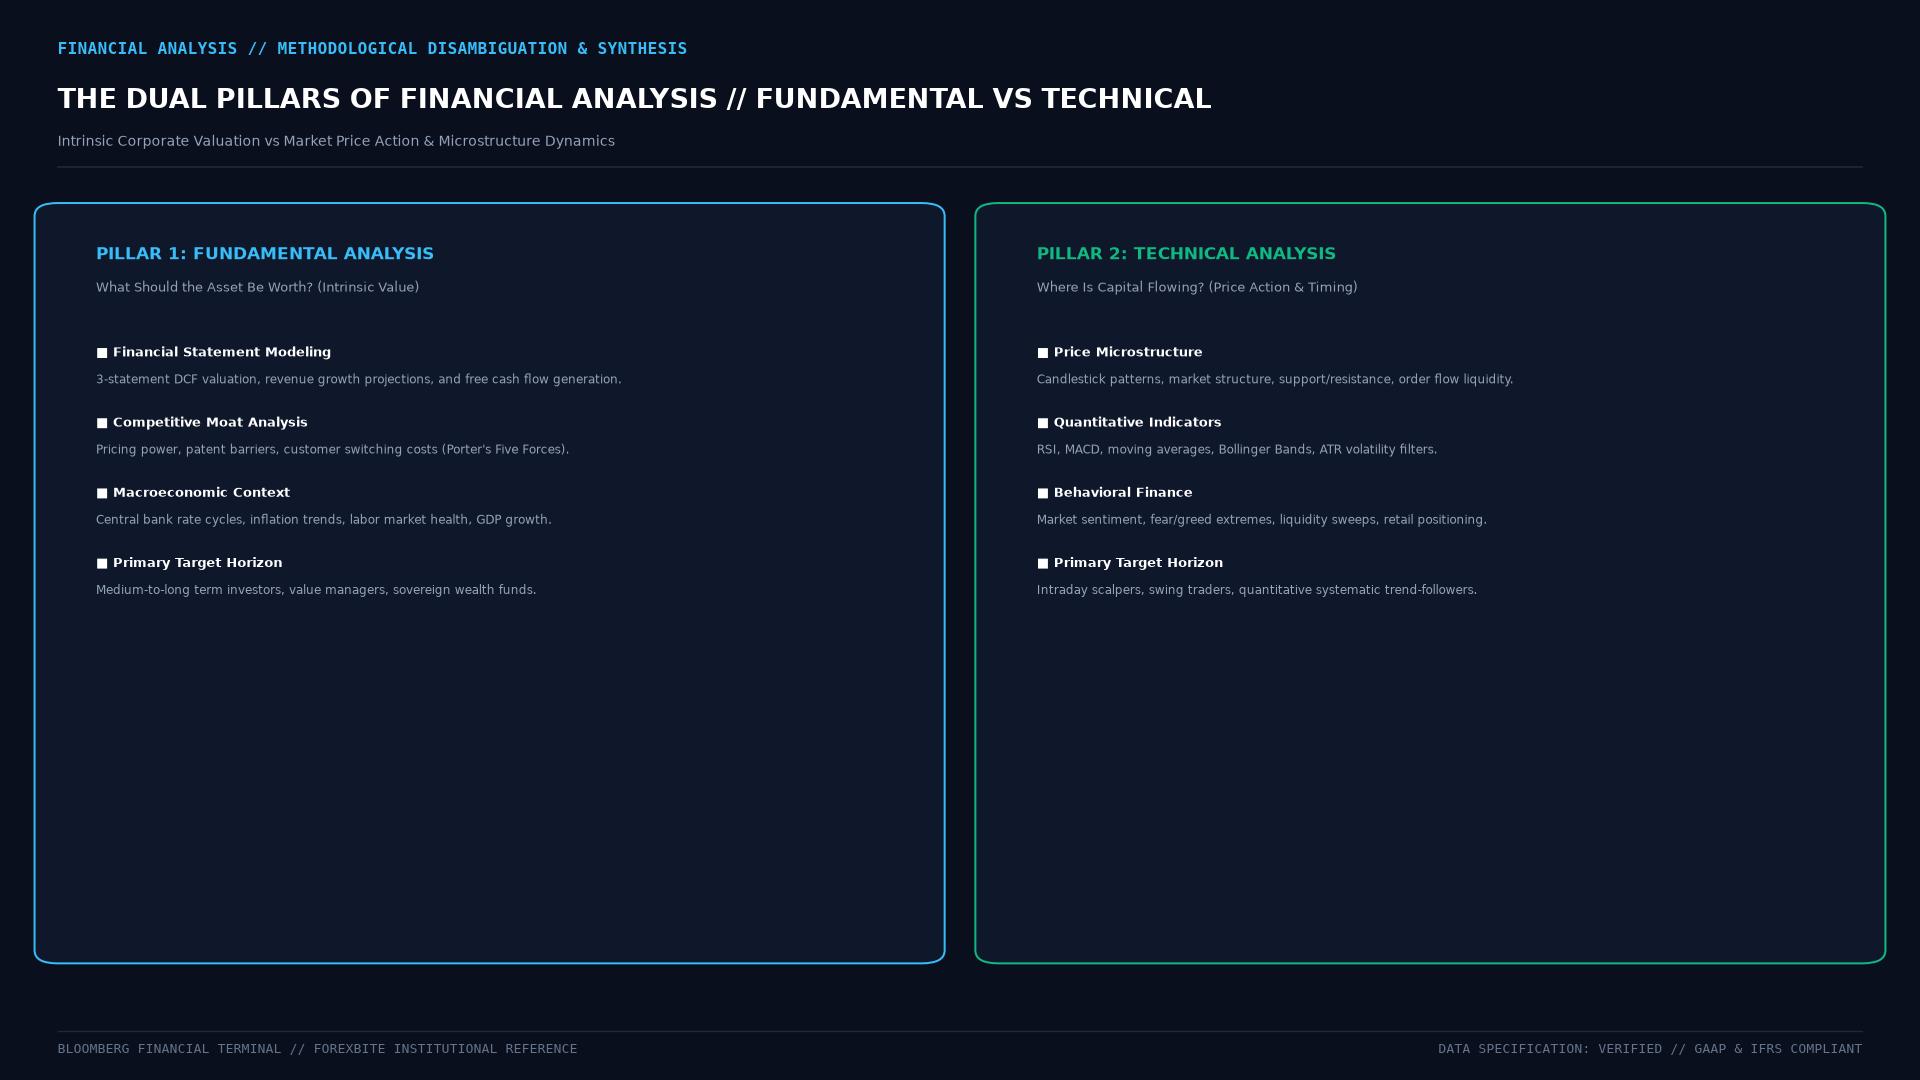 Figure: Comprehensive institutional analysis pipeline integrating Macroeconomic Top-Down Analysis, Microeconomic Bottom-Up Modeling, and Quantitative Valuation to derive high-conviction market positions.
Core Pillars of Fundamental Financial Statement Analysis
When professional equity and credit analysts evaluate a corporate issuer, they conduct three interrelated analytical procedures across historical 10-K and 10-Q regulatory filings:
1. Horizontal Analysis (Trend Evaluation)
Examines financial statement line items across successive accounting periods (typically 3 to 5 years) to identify growth trajectories, margin compression, or unusual revenue spikes:
$$\text{Percentage Change} = \left( \frac{\text{Current Period Value} - \text{Base Period Value}}{\text{Base Period Value}} \right) \times 100$$
2. Vertical Analysis (Common-Size Statements)
Standardizes every line item on a financial statement as a percentage of a single core base figure, enabling immediate structural comparisons between companies of differing sizes:
- On the Income Statement, all items (COGS, R&D, SG&A, Operating Profit) are expressed as a percentage of Total Net Revenue.
- On the Balance Sheet, all assets, liabilities, and equity tranches are expressed as a percentage of Total Assets.
3. Ratio Analysis
Decomposes corporate operational efficiency, liquidity, and solvency into standardized financial ratios:
| Analytical Category | Key Financial Ratio | Formula | Analytical Objective |
|---|---|---|---|
| Liquidity | Quick Ratio (Acid-Test) | $(\text{Cash} + \text{Marketable Securities} + \text{A/R}) / \text{Current Liabilities}$ | Ability to satisfy immediate short-term obligations |
| Solvency | Net Debt-to-EBITDA | $(\text{Total Debt} - \text{Cash}) / \text{EBITDA}$ | Structural leverage and credit default vulnerability |
| Profitability | Return on Invested Capital (ROIC) | $\text{NOPAT} / \text{Invested Capital}$ | True economic value generation above capital cost |
| Operating Efficiency | Asset Turnover | $\text{Net Sales} / \text{Average Total Assets}$ | Productivity of the corporate balance sheet |
Valuation Modeling: Discounted Cash Flow (DCF)
To analyse whether a public equity or corporate bond is overvalued or undervalued relative to prevailing secondary market prices, quantitative analysts construct Discounted Cash Flow (DCF) models.
The DCF methodology projects a firm’s Unlevered Free Cash Flow (UFCF) over a 5-to-10-year explicit forecast horizon and discounts those future cash flows back to the present using the Weighted Average Cost of Capital (WACC):
$$\text{Enterprise Value} = \sum_{t=1}^{n} \frac{\text{UFCF}_t}{(1 + \text{WACC})^t} + \frac{\text{Terminal Value}_n}{(1 + \text{WACC})^n}$$
Where:
- $\text{UFCF} = \text{EBIT} \times (1 - T_c) + \text{Depreciation & Amortization} - \text{CapEx} - \Delta \text{Net Working Capital}$.
- WACC reflects the blended required rate of return demanded by both equity shareholders and debt holders.
- Terminal Value captures all cash flows beyond the explicit forecast window, calculated using the Gordon Growth Model: $$\text{Terminal Value} = \frac{\text{UFCF}_n \times (1 + g)}{\text{WACC} - g}$$
If the calculated intrinsic value per share exceeds the current market trading price by a sufficient margin of safety (typically 15% to 25%), the analyst issues a formal buy recommendation.
                    THE DCF VALUATION WORKFLOW
+-----------------------------------------------------------------------+
| Step 1: Forecast Unlevered Free Cash Flows (Years 1 to 5)             |
+-----------------------------------------------------------------------+
                                   │
                                   ▼
+-----------------------------------------------------------------------+
| Step 2: Calculate WACC using CAPM Cost of Equity & After-Tax Debt Cost|
+-----------------------------------------------------------------------+
                                   │
                                   ▼
+-----------------------------------------------------------------------+
| Step 3: Discount Cash Flows to Present Value + Discount Terminal Value|
+-----------------------------------------------------------------------+
                                   │
                                   ▼
+-----------------------------------------------------------------------+
| Step 4: Subtract Net Debt to arrive at Total Implied Equity Value     |
| Step 5: Divide by Diluted Shares to determine Fair Intrinsic Price    |
+-----------------------------------------------------------------------+
How to Analyse Foreign Exchange (FX) Markets
Unlike corporate equities, national currencies do not have balance sheets, earnings per share, or dividend yields. To analyse currency pairs (such as EUR/USD or USD/JPY), macro analysts focus on sovereign and macroeconomic drivers:
- Monetary Policy Divergence: Central bank policy rates and forward guidance represent the primary driver of medium-term FX trends. The currency of a central bank raising benchmark interest rates generally appreciates as global capital pursues higher risk-adjusted yields (Carry Trade).
- Purchasing Power Parity (PPP) and Terms of Trade: Evaluates whether a currency is structurally overvalued or undervalued relative to the relative cost of a standardized basket of traded goods across borders.
- Current Account Balances and Capital Inflows: Nations running persistent trade surpluses (exporting more than they import) generate natural commercial demand for their domestic currency, supporting long-term valuation.
Frequently Asked Questions
Is there any operational difference between “analyse” and “analyze”?
No. “Analyse” is the standard spelling in Commonwealth English (United Kingdom, Australia, New Zealand, South Africa, and international financial institutions utilizing IFRS standards), whereas “analyze” is the standard American English spelling. In global financial literature, both terms describe the identical analytical process.
What is the difference between fundamental analysis and technical analysis?
Fundamental analysis seeks to determine an asset’s intrinsic economic value by examining financial statements, cash flows, competitive industry positioning, and macroeconomic variables. Technical analysis ignores intrinsic value entirely, evaluating historical price charts, trading volume, and market microstructure patterns to forecast future price movements.
What is sensitivity analysis in financial modeling?
Sensitivity analysis is a quantitative stress-testing technique where an analyst modifies individual key inputs in a valuation model (such as changing the revenue growth rate by $\pm 2%$ or the WACC discount rate by $\pm 100$ basis points) to observe how dramatically the target stock price or bond valuation responds. This helps identify the key risk variables driving an investment thesis.
Ready to trade forex?
Open a free demo account with a regulated broker. Practice with virtual funds before risking real money.