Analysis
Analysis is the systematic examination of market data, macroeconomic variables, and price behavior using fundamental, technical, and quantitative disciplines to identify trading opportunities and optimize portfolio risk.
What Is Market Analysis?
In financial trading and institutional asset management, analysis is the structured discipline of synthesizing raw market data, economic indicators, corporate disclosures, and order flow microstructure to extract actionable trading signals and manage portfolio risk. Rather than relying on intuition or speculation, disciplined market participants use analysis to establish probability-weighted frameworks that determine trade direction, entry timing, position sizing, and stop-loss placement.
Professional market analysis rests on three interrelated analytical pillars: Fundamental Analysis, Technical Analysis, and Sentiment/Microstructure Analysis. Institutional trading desks routinely blend these three disciplines into a coherent execution strategy.
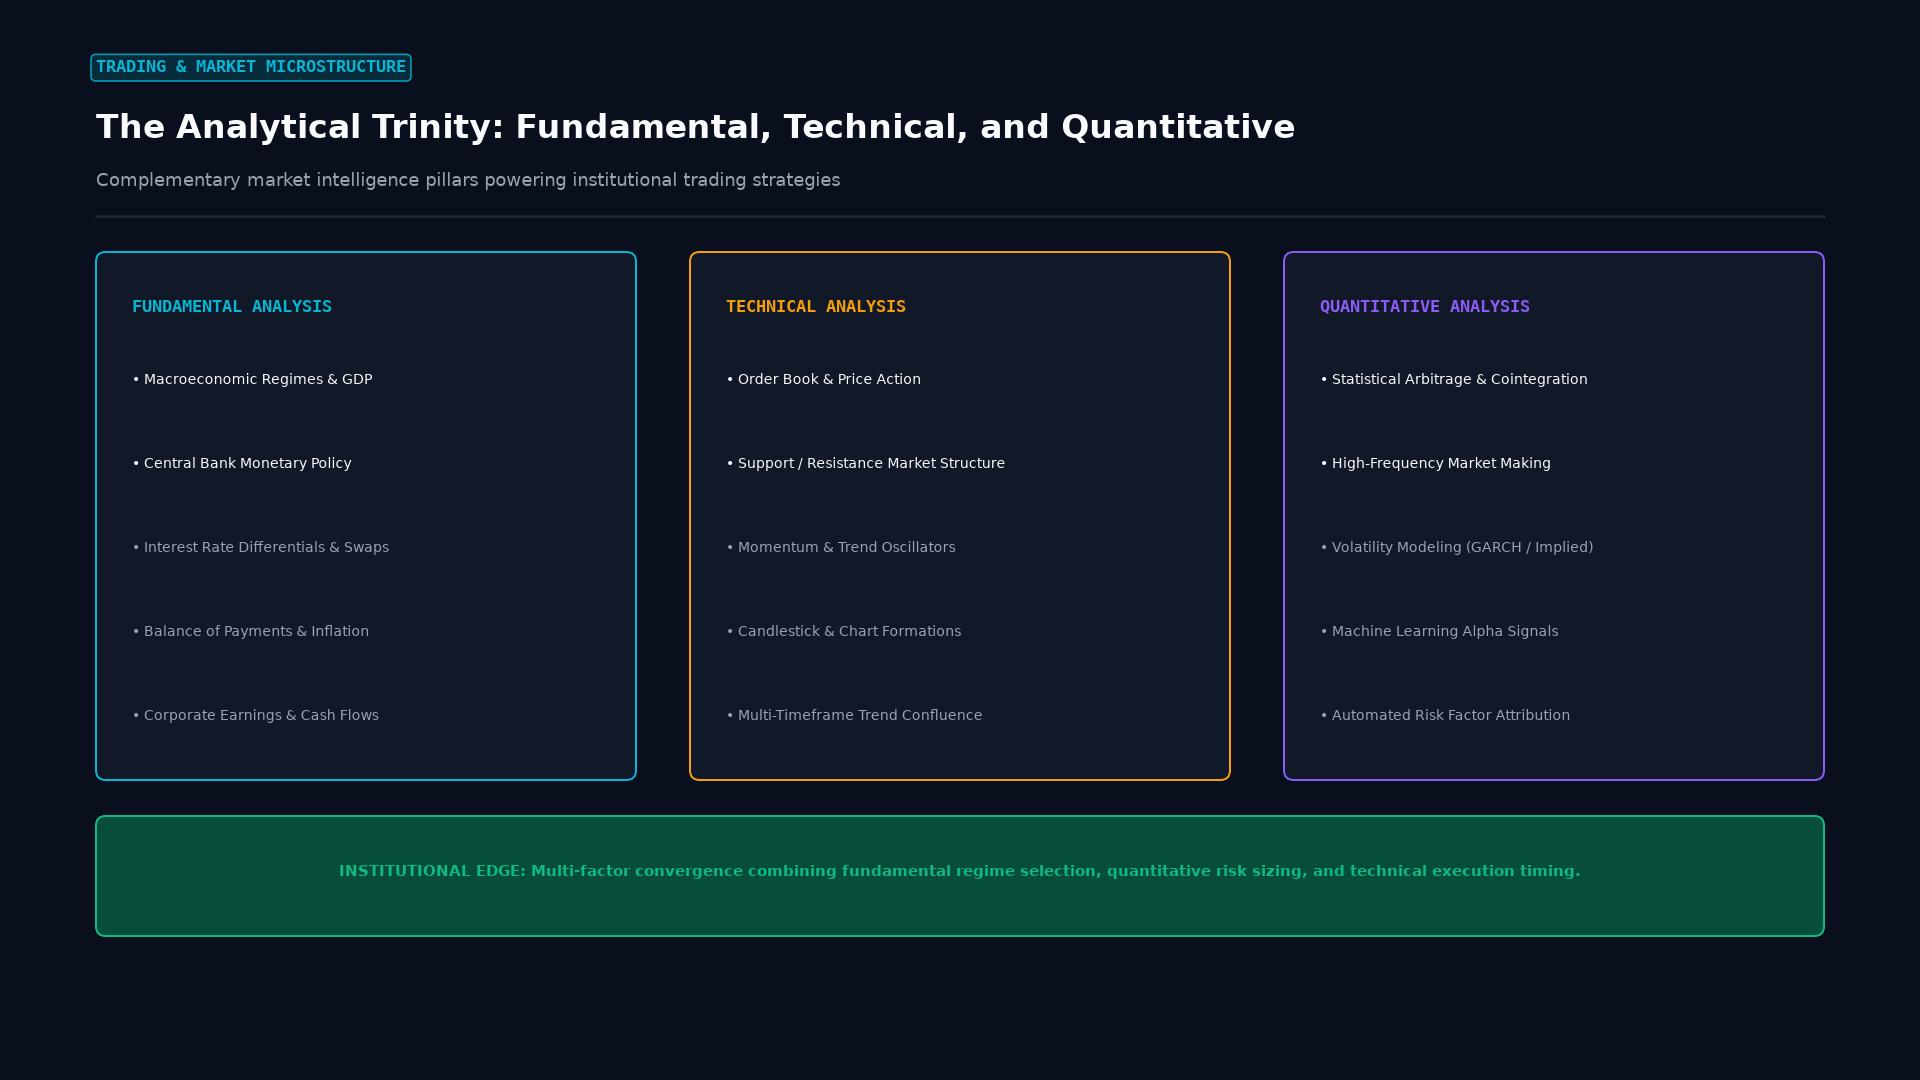 Figure: The tripartite market intelligence framework: combining macro regime modeling, technical market structure analysis, and quantitative algorithmic risk controls.
The Three Core Analytical Disciplines
Modern market participants evaluate market opportunities through three distinct lenses:
1. Fundamental Analysis: Establishing Directional Bias
Fundamental analysis focuses on economic and financial reality to determine what an asset ought to be worth.
- In Equity Markets, it evaluates corporate revenue growth, profit margins, free cash flow generation, and competitive advantages to calculate intrinsic fair value.
- In Foreign Exchange (FX), it assesses central bank policy rate differentials, terms of trade, sovereign fiscal deficits, and inflation dynamics to establish long-term macro directional trends.
2. Technical Analysis: Precision Timing and Microstructure
Technical analysis studies past market data (primarily price action and volume) to identify recurring psychological patterns and institutional order absorption:
- Identifies major supply and demand zones, liquidity pools, and breakout levels.
- Employs quantitative price filters such as exponential moving averages (EMAs), Average True Range (ATR), and the Relative Strength Index (RSI).
- Defines strict risk boundaries by anchoring stop-loss orders behind confirmed technical structure.
3. Sentiment and Positioning Analysis: The Market Consensus
Sentiment analysis measures how existing market participants are positioned, identifying when consensus trades become crowded and vulnerable to sharp unwinds:
- CFTC Commitment of Traders (COT) Report: Tracks commercial hedgers versus non-commercial speculative positioning in futures markets.
- Options Gamma Exposure (GEX): Quantifies dealer hedging requirements, forecasting whether options market makers will dampen or accelerate market volatility.
- Retail Sentiment Ratios: Measures retail trader long/short ratios, serving as a reliable contrarian indicator at market inflection points.
Multi-Timeframe Analysis (MTFA) Framework
Professional proprietary traders never analyze a chart in isolation. They employ Multi-Timeframe Analysis (MTFA), cascading down from high-level structural trends to low-level execution triggers:
                    MULTI-TIMEFRAME ANALYSIS CASCADE
+-----------------------------------------------------------------------+
| HIGHER TIMEFRAME (Weekly / Daily): Macro Trend & Dominant Liquidity   |
| - Identifies overall trend, key institutional support & resistance     |
+-----------------------------------------------------------------------+
                                   │
                                   ▼
+-----------------------------------------------------------------------+
| INTERMEDIATE TIMEFRAME (4-Hour / 1-Hour): Market Structure & Swings    |
| - Pinpoints shift in market structure (BOS, CHoCH, pullbacks)         |
+-----------------------------------------------------------------------+
                                   │
                                   ▼
+-----------------------------------------------------------------------+
| LOWER TIMEFRAME (15-Minute / 5-Minute): Execution & Trade Trigger     |
| - Identifies precise entry candlestick confirmation, minimizing stop  |
+-----------------------------------------------------------------------+| Timeframe Tier | Typical Chart Period | Analytical Role | Primary Indicator Focus |
|---|---|---|---|
| Strategic (Macro) | Weekly / Daily | Establishes overall trend bias and major institutional support/resistance | 50/200-day Simple Moving Average, macro pivot points |
| Tactical (Structure) | 4-Hour / 1-Hour | Identifies chart patterns, retracement pullbacks, and range consolidations | Fibonacci retracements, Volume Profile, VPVR |
| Operational (Entry) | 15-Minute / 5-Minute | Fine-tunes exact entry order placement and calculates stop-loss distance | Candlestick rejection wicks, VWAP, intraday ATR |
Quantitative and Statistical Analysis
Beyond classical chart reading, quantitative analysis applies mathematical models to historical time series to uncover statistical edges:
- Mean Reversion and Cointegration: Pairs trading strategies analyze two historically correlated assets (such as gold and silver, or two competitor energy equities). When the pricing spread deviates beyond two standard deviations from its historical mean, algorithms simultaneously short the outperforming asset and buy the underperforming asset, anticipating statistical reversion.
- Volatility Analysis: Measuring historical realized volatility against option-implied volatility (IV) allows traders to identify volatility mispricings. In foreign exchange, traders calculate implied volatility surfaces to hedge tail risks prior to major macroeconomic news releases.
- Backtesting and Out-of-Sample Validation: Algorithmic trading systems are rigorously stress-tested across decades of historical tick data. To prevent overfitting, quantitative analysts partition datasets into in-sample training periods and out-of-sample testing phases, measuring key metrics like the Sharpe ratio, Sortino ratio, and maximum drawdown.
Cognitive Biases That Corrupt Market Analysis
Even the most sophisticated analytical frameworks fail when traders succumb to psychological biases:
- Confirmation Bias: The tendency to seek out research, news headlines, and commentary that validate an existing open position while disregarding contradictory technical breakdowns or deteriorating fundamentals.
- Recency Bias: Extrapolating the immediate past into the distant future by assuming that an aggressive bull trend will continue indefinitely, leading traders to buy tops and ignore distribution patterns.
- Analysis Paralysis: Overloading trading screens with dozens of conflicting technical indicators and news feeds, preventing the trader from executing valid setups due to conflicting inputs.
Frequently Asked Questions
Which type of analysis is best for day trading?
For intraday trading, technical and microstructure analysis (such as price action, VWAP, and Level 2 order book flow) takes precedence because intraday price swings are driven primarily by order flow and liquidity imbalances. However, day traders must still monitor macroeconomic economic calendars to avoid holding unhedged positions into volatile data releases.
How does technical analysis differ from fundamental analysis in forex?
In foreign exchange, fundamental analysis determines why a currency pair should trend over months or quarters based on central bank interest rates, economic growth, and trade balances. Technical analysis identifies where and when to enter trades by identifying entry levels, momentum shifts, and risk-defined stop-loss points on price charts.
What is the difference between quantitative analysis and technical analysis?
Technical analysis typically relies on visual chart patterns, subjective trendlines, and heuristic indicators (like RSI or Bollinger Bands) interpreted by human traders. Quantitative analysis relies on rigorous mathematical, statistical, and algorithmic modeling of price, volume, and order flow data, executing rules-based trades programmatically with zero subjective discretion.
Ready to trade forex?
Open a free demo account with a regulated broker. Practice with virtual funds before risking real money.