Annual returns
Annual returns measure the percentage change in the market value of an investment over a 12-month period, reflecting capital gains, price changes, and reinvested dividends or interest.
What Are Annual Returns in Investing?
Annual returns represent the percentage gain or loss generated by an investment portfolio, individual security, or broad asset class across a 12-month calendar year or trailing period. Rather than measuring simple price appreciation, comprehensive institutional performance reporting measures Total Annual Return, which incorporates both capital gains (or losses) and all cash distributions (including dividend payouts, bond coupon payments, and interest yields) reinvested back into the underlying asset.
Tracking annual returns allows institutional allocators, wealth managers, and individual investors to evaluate historical performance, assess risk-adjusted efficiency, benchmark active portfolio managers against broad market indices (such as the S&P 500 or MSCI World), and construct diversified long-term asset allocation models.
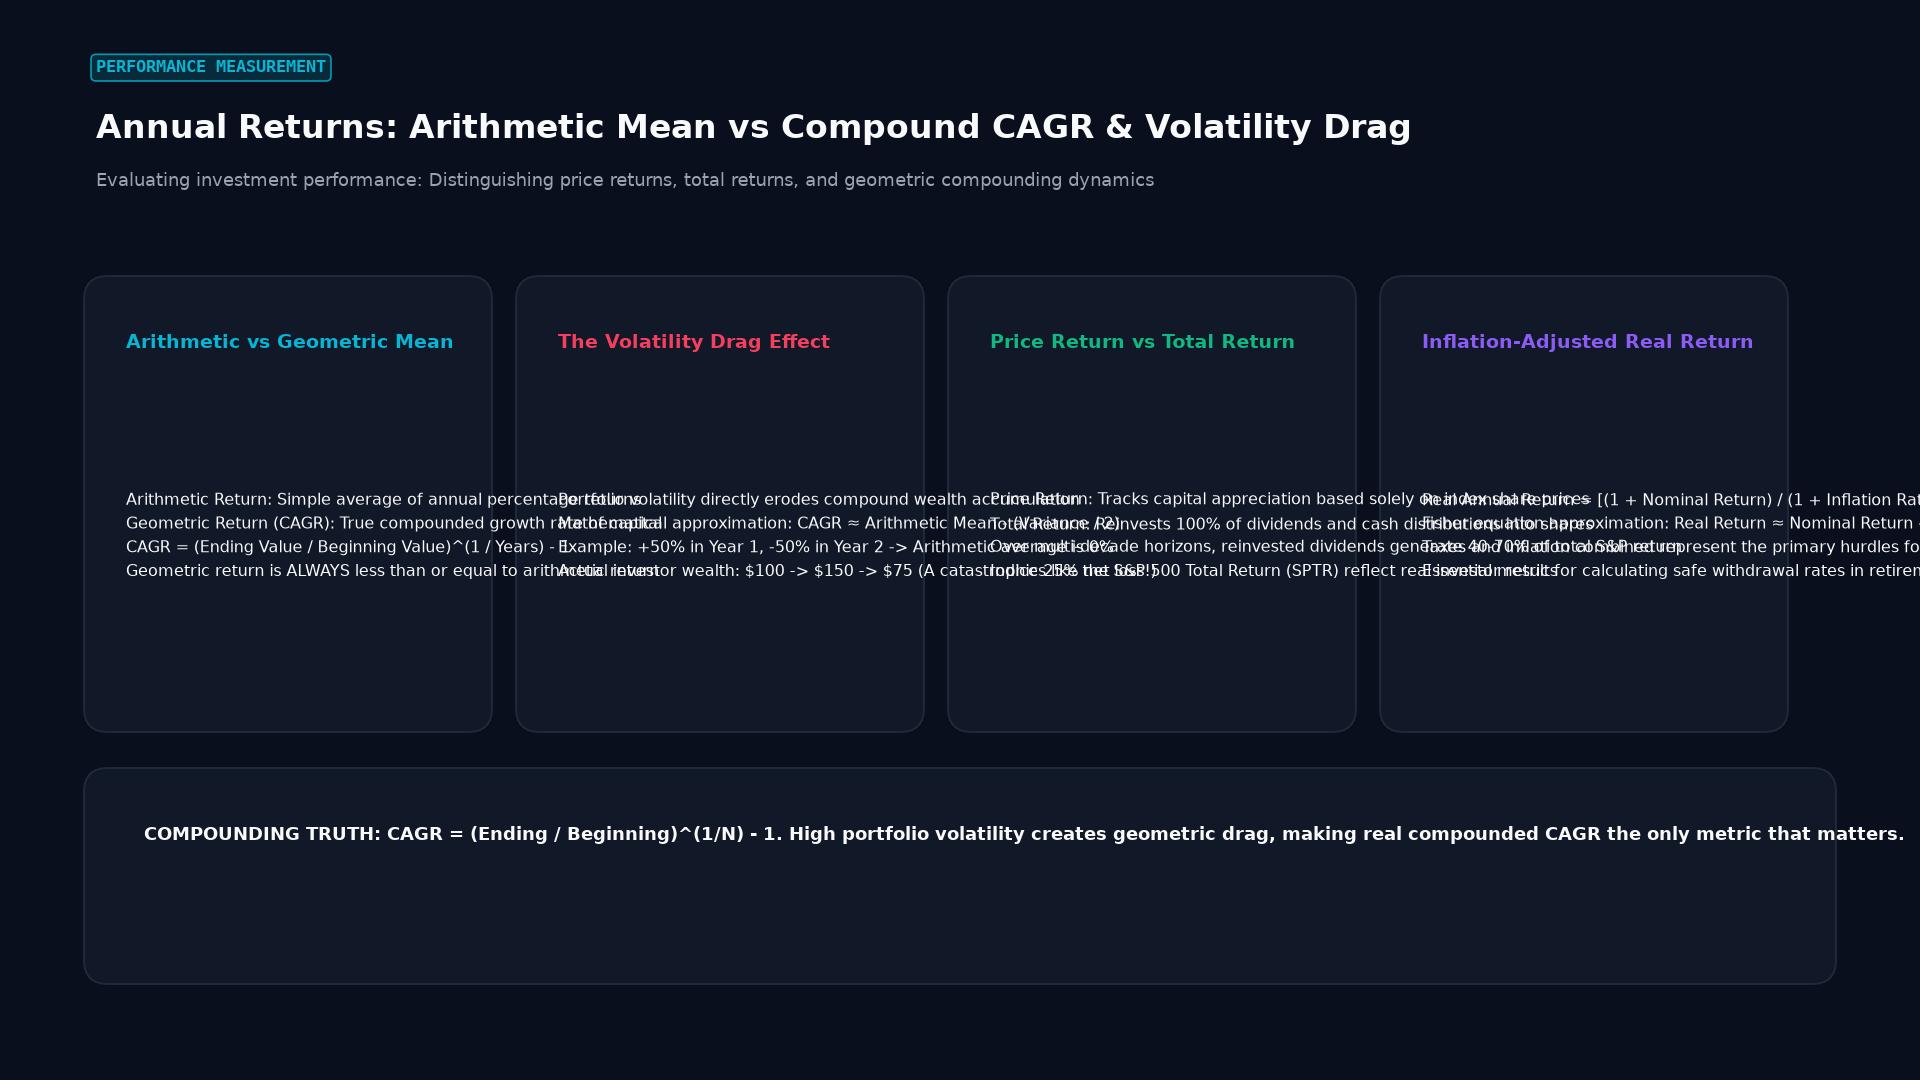 Figure: Evaluating investment performance: Distinguishing price returns, total returns, and geometric compounding dynamics
Arithmetic Mean vs. Geometric Mean (CAGR)
When evaluating annual returns across multiple successive years, investors must distinguish between the simple arithmetic average and the true Compound Annual Growth Rate (CAGR):
1. The Volatility Drag (Arithmetic vs. Geometric Disconnect)
Suppose an investment of $10,000 achieves the following annual returns across two years:
- Year 1: $+50.0%$ (Ending Balance: $$15,000$)
- Year 2: $-50.0%$ (Ending Balance: $$7,500$)
The Arithmetic Average Return suggests the investor broke even:
$$\text{Arithmetic Mean} = \frac{+50.0% + (-50.0%)}{2} = \mathbf{0.0%}$$
However, the investor suffered a $2,500 real capital loss (losing 25% of their initial wealth). The true economic return is captured exclusively by the Geometric Mean Return (CAGR):
$$\text{CAGR} = \left( \frac{\text{Ending Value}}{\text{Beginning Value}} \right)^{\frac{1}{n}} - 1 = \left( \frac{$7,500}{$10,000} \right)^{\frac{1}{2}} - 1 = \sqrt{0.75} - 1 = \mathbf{-13.40%\text{ per year}}$$
This divergence, known as volatility drag, demonstrates why minimizing portfolio drawdowns is mathematically more critical for long-term compounding than chasing volatile positive spikes.
Time-Weighted Return (TWR) vs. Money-Weighted Return (MWR)
In institutional wealth management, regulatory bodies (such as the CFA Institute under the Global Investment Performance Standards - GIPS) mandate specific calculation methodologies to evaluate portfolio managers:
| Metric | Calculation Method | Impact of Client Cash Inflows/Outflows | Primary Use Case |
|---|---|---|---|
| Time-Weighted Return (TWR) | Geometrically links sub-period returns, neutralizing external cash flows | Completely isolates manager skill; ignores cash deposit timing | Evaluating mutual fund, ETF, and active hedge fund managers |
| Money-Weighted Return (MWR / IRR) | Calculates the internal rate of return (IRR) equating net present value to zero | Heavily sensitive to the size and timing of client cash deposits | Evaluating private equity, private debt, and individual investor accounts |
                 TWR VS. MWR INFLOW TIMING DIVERGENCE
Portfolio Manager achieves +20% in Year 1 and -10% in Year 2.
Client deposits $10,000 at start of Year 1, and $200,000 right before Year 2 drop.
- Time-Weighted Return (TWR): Evaluates manager as POSITIVE (+8.0% cumulative).
- Money-Weighted Return (MWR): Client suffered massive dollar loss; IRR is sharply NEGATIVE!
Real vs. Nominal Annual Returns: The Fisher Equation
To understand the true purchasing power generated by an investment, annual returns must be adjusted for consumer price inflation:
$$\text{Real Return} \approx \text{Nominal Return} - \text{Inflation Rate}$$
More precisely, using the exact Fisher Equation:
$$1 + r_{\text{real}} = \frac{1 + r_{\text{nominal}}}{1 + i}$$
Where:
- $r_{\text{nominal}}$ = Stated percentage gain in dollar terms.
- $i$ = Inflation rate (measured by the Consumer Price Index - CPI).
- $r_{\text{real}}$ = Net increase in physical goods and services purchasing power.
If a bond portfolio generates an 8.0% nominal annual return during a year when inflation runs at 6.0%, the real purchasing power return is only +1.89%.
Historical Benchmark Returns Across Asset Classes
Long-term empirical data across major US capital asset classes reveals the historical risk-return spectrum (1926–Present):
| Asset Class | Nominal Long-Term CAGR | Real Long-Term CAGR (Inflation-Adjusted) | Annualized Standard Deviation (Risk) |
|---|---|---|---|
| Large-Cap US Equities (S&P 500) | ~10.2% | ~7.0% | ~19.5% |
| Small-Cap US Equities (Russell 2000) | ~11.8% | ~8.4% | ~25.2% |
| Long-Term US Corporate Bonds | ~6.1% | ~3.0% | ~8.4% |
| 10-Year US Treasury Notes | ~5.2% | ~2.1% | ~6.8% |
| 30-Day US Treasury Bills (Cash) | ~3.3% | ~0.3% | ~3.1% |
Frequently Asked Questions
What is the difference between an annual return and an annualized return?
An annual return is the actual percentage return realized across a specific, single 12-month calendar year (e.g., the S&P 500 gained 26.3% in 2023). An annualized return converts performance measured over multi-year or sub-annual timeframes into a standardized geometric equivalent annual rate (e.g., a 45% return over three years equals a 13.2% annualized return).
Do published annual returns on mutual funds reflect investment fees?
Under SEC rules, mutual fund and ETF performance tables must report net annual returns after deducting ongoing management fees and fund operating expenses (the fund’s expense ratio). However, published returns do not reflect personal income taxes or brokerage commissions paid by the investor.
Why can’t past annual returns predict future performance?
Capital markets operate under dynamic macroeconomic regimes where interest rates, corporate profit margins, and valuation multiples constantly shift. A sector that delivers a +40% annual return in one year often suffers capital rotation and severe underperformance in subsequent cycles.
Ready to trade forex?
Open a free demo account with a regulated broker. Practice with virtual funds before risking real money.