Annualize
To annualize is the mathematical process of converting an interest rate, investment return, or volatility metric measured over a shorter period into an equivalent twelve-month standard rate.
What Does It Mean to Annualize in Finance?
To annualize is to mathematically convert a financial metric, interest rate, investment return, or statistical volatility reading measured over a period of less than a year (such as a day, week, month, or quarter) into an equivalent 12-month standard rate.
In investment analysis and corporate finance, annualization is essential for creating meaningful, like-for-like comparisons. Without annualization, an investor cannot readily determine whether a hedge fund generating a 3.5% return over 45 days is outperforming a corporate bond paying 7.2% annually, or whether a technology startup producing $2.5 million in quarterly revenue is growing faster than an enterprise generating $10 million over twelve months.
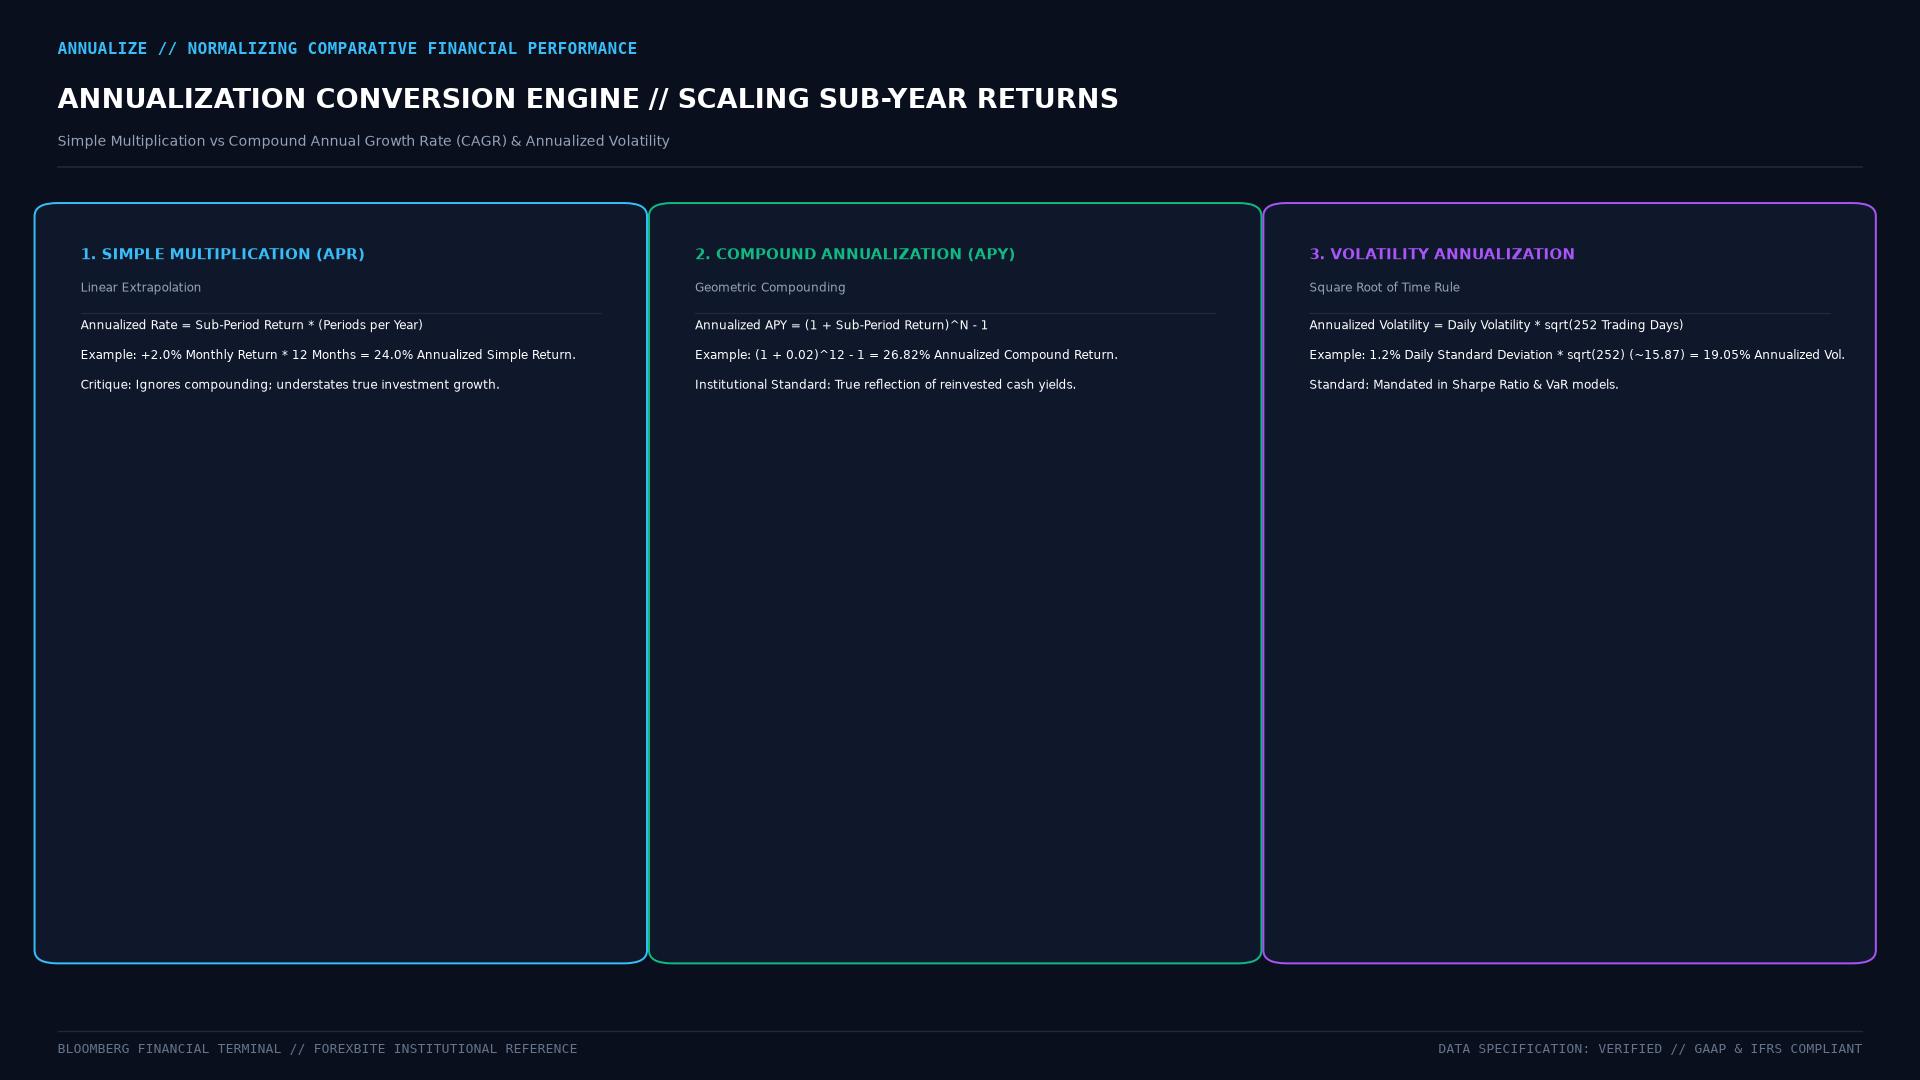 Figure: Mathematical and empirical annualization models for sub-annual holding period returns, compound annual growth rate (CAGR), and square-root-of-time volatility scaling ($\sigma \times \sqrt{252}$).
Mathematical Methods: Simple vs. Compound Annualization
Financial analysts utilize two distinct mathematical methodologies to annualize periodic returns, depending on whether the asset reinvests cash flows:
1. Simple Annualization (Linear Multiplication)
Used primarily in short-term money markets, commercial paper, and simple interest loans where returns do not compound within the year:
$$\text{Annualized Rate (Simple)} = R_{\text{period}} \times \left( \frac{\text{Periods per Year}}{1} \right) = R_{\text{period}} \times \left( \frac{365}{\text{Days in Period}} \right)$$
Example: A short-term certificate of deposit earns 1.25% over a 90-day holding period: $$\text{Simple Annualized Rate} = 1.25% \times \left( \frac{365}{90} \right) = 1.25% \times 4.0556 = \mathbf{5.07%}$$
2. Compound Annualization (Geometric Compounding)
Mandated in equity portfolio management, mutual fund reporting, and derivatives valuation to account for the geometric compounding of reinvested capital:
$$\text{Annualized Return (Compound)} = (1 + R_{\text{period}})^n - 1 = (1 + R_{\text{period}})^{\frac{365}{\text{Days}}} - 1$$
Where $n$ represents the number of compounding periods in a full year ($n=12$ for monthly, $n=4$ for quarterly).
Example: A commodity trading advisor (CTA) delivers a +2.0% return in a single month: $$\text{Compound Annualized Return} = (1 + 0.02)^{12} - 1 = (1.02)^{12} - 1 = 1.26824 - 1 = \mathbf{+26.82%}$$
Notice the substantial divergence: simple multiplication yields 24.0% ($2.0% \times 12$), while compound annualization correctly captures the reinvestment of monthly profits to show 26.82%.
Annualizing Volatility: The Square-Root-of-Time Rule
In quantitative finance and derivatives risk management, price volatility does not scale linearly with time. Because asset prices are assumed to follow a random walk under geometric Brownian motion, price variances add up linearly across time, while standard deviation (volatility) scales with the square root of time:
$$\sigma_{\text{annual}} = \sigma_{\text{daily}} \times \sqrt{T}$$
Where:
- $\sigma_{\text{daily}}$ = Historical standard deviation of daily percentage price returns.
- $T$ = Number of active trading days in a calendar year (standardized at 252 trading days for equities and bonds, or 365 days for crypto).
                 SQUARE ROOT OF TIME SCALING (√252)
Daily Price Volatility (σ_daily): 1.15%
Equities Trading Days per Year:   252 days
Scaling Factor:                  √252 ≈ 15.8745
Annualized Volatility (σ_annual): 1.15% × 15.8745 = 18.26%
In institutional foreign exchange and equity options pricing, traders utilize this formula to convert daily price fluctuations into the annualized implied volatility figures entered into the Black-Scholes-Merton options pricing model.
Macroeconomic Data: Annualized GDP and Inflation
Government statistical bureaus routinely annualize macroeconomic economic releases to provide policy makers with standardized annualized growth trajectories:
- US Bureau of Economic Analysis (BEA): Reports quarterly Gross Domestic Product (GDP) on a Seasonally Adjusted Annual Rate (SAAR) basis: $$\text{Annualized GDP Growth} = \left[ \left( \frac{\text{GDP}t}{\text{GDP}{t-1}} \right)^4 - 1 \right] \times 100$$ If US real GDP expands by 0.7% from Q1 to Q2, the headline release announces that the economy expanded at a 2.8% annualized rate.
- European Convention Divergence: Unlike the US, Eurostat and European national statistical agencies traditionally emphasize the raw non-annualized quarter-on-quarter growth rate alongside the year-over-year rate. Macro traders must be careful not to confuse an un-annualized European quarterly figure (+0.5%) with an annualized US headline figure (+2.0%), which reflect virtually identical underlying economic momentum.
Pitfalls and Distortions in Annualization
While mathematically sound, annualizing short-term metrics introduces severe cognitive and operational risks:
- The Small Sample Extrapolation Fallacy: Annualizing performance measured over very short intervals (such as a single day, week, or month) produces absurd projections. A quantitative trading desk that makes +5.0% in its first week of operation would theoretically annualize to an impossible +1,046% per year ($(1.05)^{52} - 1$), ignoring inevitable drawdowns and liquidity constraints.
- Ignoring Seasonality: In retail consumer sectors, companies generate up to 60% of their annual operating earnings during the Q4 holiday quarter. Annualizing Q4 results by multiplying by four drastically overstates full-year earnings capacity.
- Survivorship and Selection Bias: Marketing brochures for newly launched alternative funds often highlight annualized returns based on three months of pristine backtested performance, misleading retail allocators into expecting multi-year consistency.
Frequently Asked Questions
Why do equity markets use 252 days to annualize instead of 365?
Public stock exchanges (such as the NYSE and NASDAQ) are closed on weekends and federal holidays, resulting in approximately 252 active trading sessions per calendar year. Financial calculations involving trading returns and volatility scale strictly by the number of days trading actually occurred.
How do subscription software companies annualize monthly revenue?
In software-as-a-service (SaaS) corporate finance, companies track Monthly Recurring Revenue (MRR). To calculate Annual Recurring Revenue (ARR), finance teams multiply MRR by twelve ($\text{ARR} = \text{MRR} \times 12$), providing private equity and venture investors with a normalized run-rate valuation metric.
Can negative returns be annualized?
Yes. Negative returns can be annualized using the identical compound formula: $\text{Annualized Return} = (1 - R_{\text{period}})^n - 1$. For example, a portfolio that loses 3.0% per quarter over two quarters reflects a compound annualized drawdown of $-11.47%$ ($[1 - 0.03]^4 - 1$).
Ready to trade forex?
Open a free demo account with a regulated broker. Practice with virtual funds before risking real money.