Symmetrical Triangle
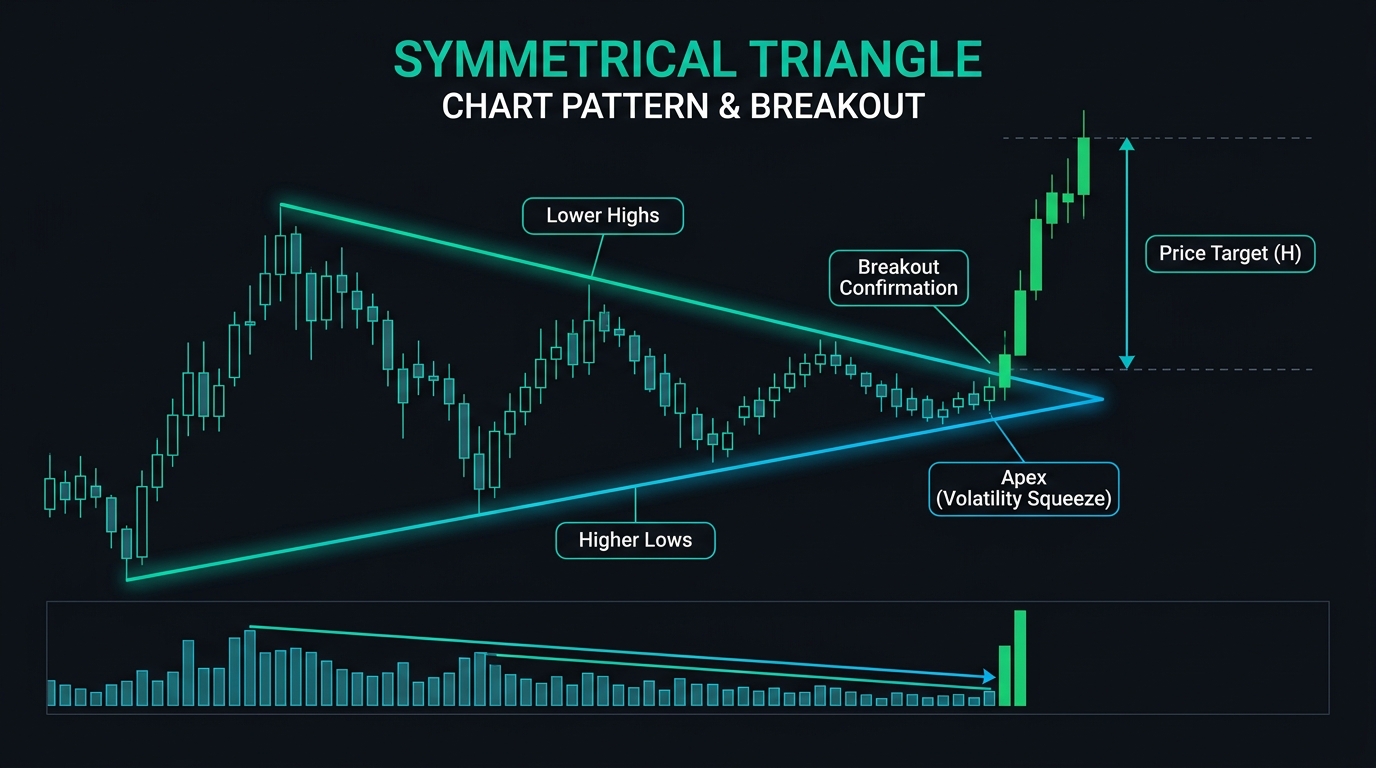
A bilateral technical chart pattern formed by two converging trendlines connecting sequential lower swing highs and higher swing lows, indicating a period of volatility compression and market indecision prior to a breakout.
What Is a Symmetrical Triangle?
A symmetrical triangle (commonly referred to in technical analysis as a coil) is a classical bilateral consolidation pattern. It develops when an asset’s price action contracts into an increasingly narrow trading range, bounded by two distinctly converging trendlines:
- An upper downward-sloping resistance trendline connecting a sequence of progressively lower swing highs.
- A lower upward-sloping support trendline connecting a sequence of progressively higher swing lows.
The symmetrical triangle represents a state of temporary equilibrium between buyers and sellers. As the pattern progresses toward its convergence point (the apex), volatility steadily compresses like a wound spring.
Unlike ascending triangles (which carry a bullish bias) or descending triangles (which carry a bearish bias), a symmetrical triangle is inherently neutral. While traditionally regarded as a continuation pattern that resolves in the direction of the prevailing broader trend, it can frequently break out in either direction, demanding disciplined confirmation before capital is committed.
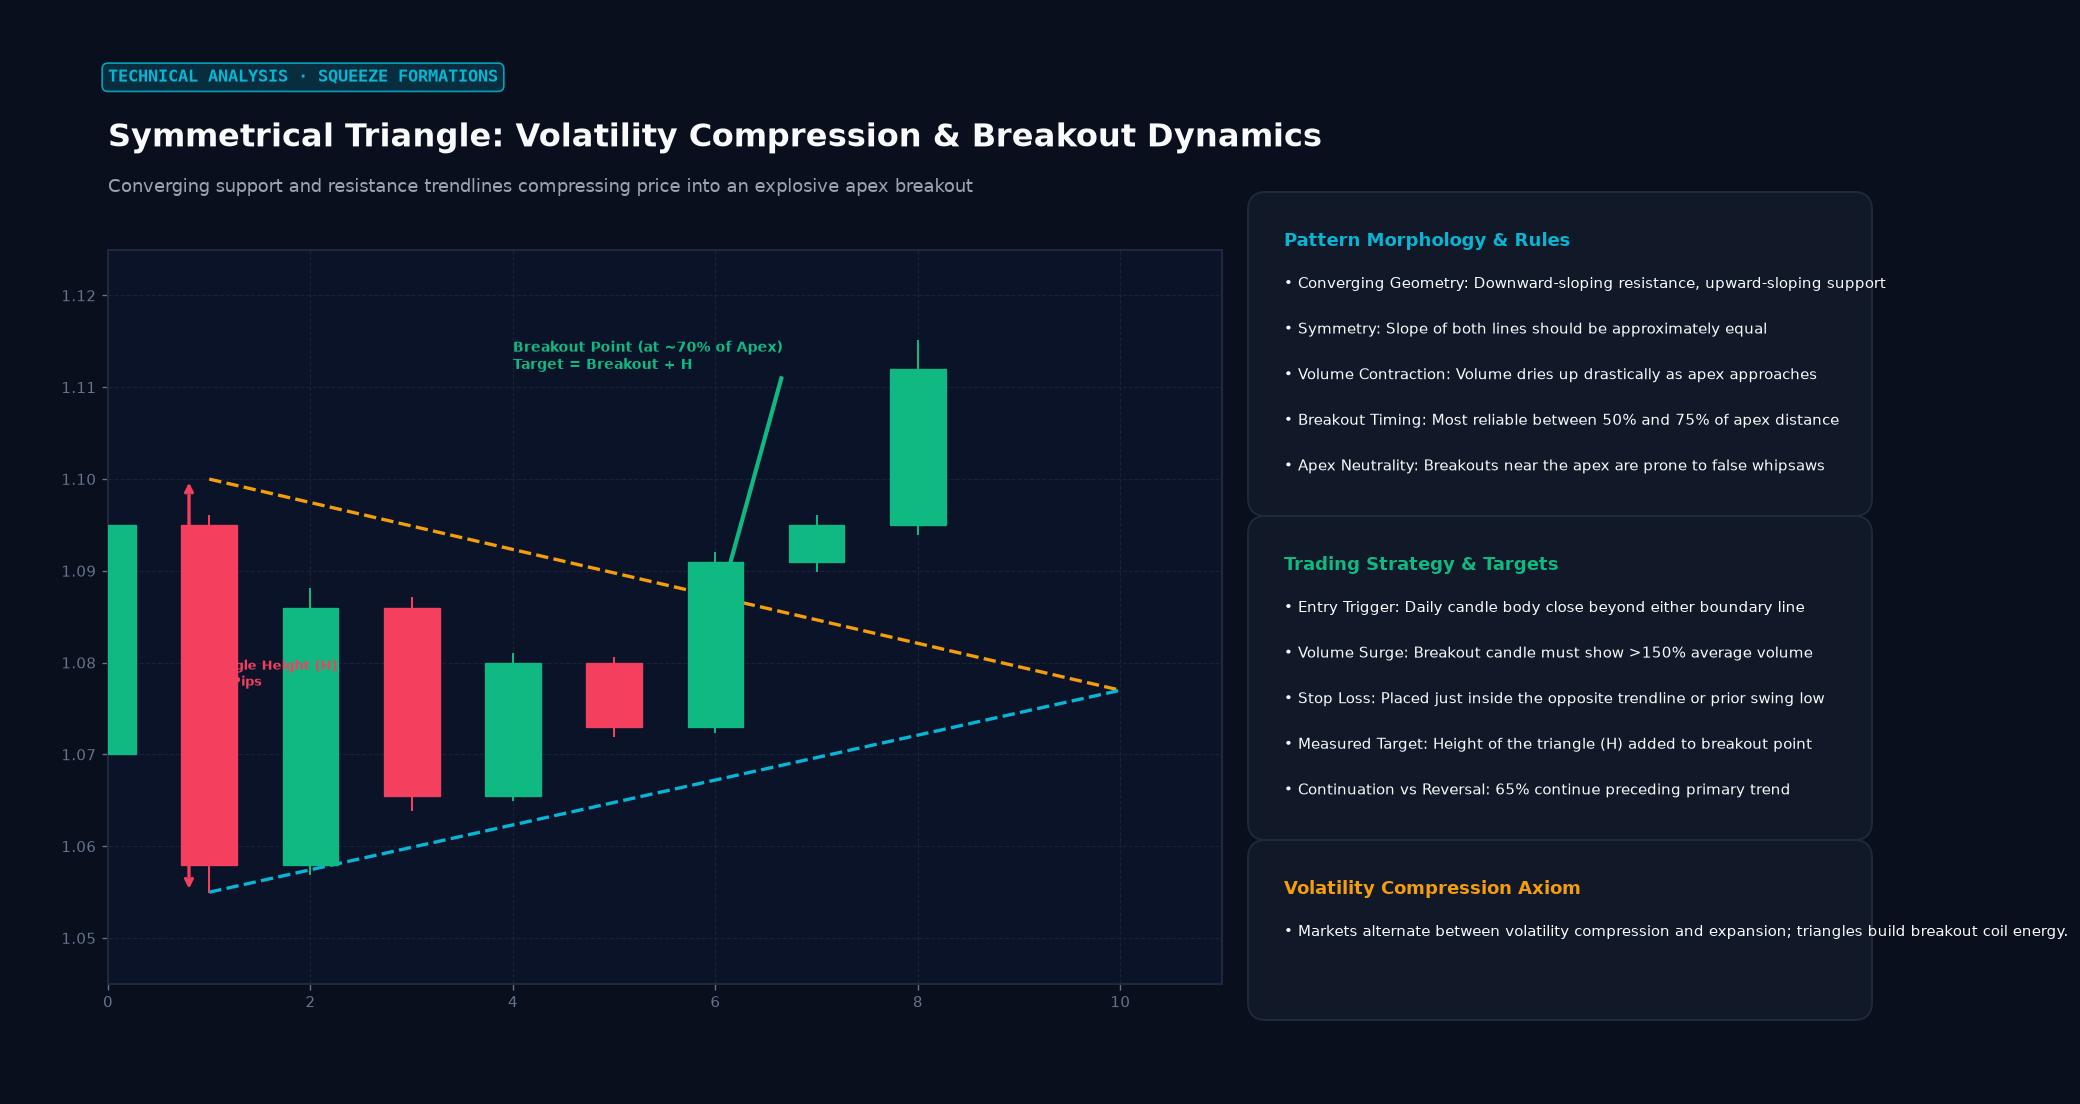 Figure: Converging support and resistance trendlines compressing price into an explosive apex breakout
Structural Identification Rules
For a symmetrical triangle to be deemed valid by institutional quantitative filters and chartists, it must satisfy specific geometric and volume criteria:
- Four-Touch Minimum: The price must cleanly test each boundary line at least twice. This requires a minimum of two distinct swing highs for the upper resistance line and two distinct swing lows for the lower support line.
- Decreasing Volume Profile: Trading volume must steadily contract as the pattern develops toward the apex. Diminishing volume reflects market participants stepping aside as volatility compresses into an indecisive coil.
- The 2/3 to 3/4 Breakout Rule: Classical technical analysis dictates that the most dependable, powerful breakouts occur between two-thirds and three-quarters of the horizontal distance from the triangle’s base to its apex. Breakouts that occur too early are prone to failure, while price action that drifts sluggishly into the very tip of the apex usually degrades into a directionless, choppy consolidation.
Mathematical Target Projection: The Measured Move
Technical analysts project objective minimum profit targets upon a confirmed breakout using two established methodologies:
PATTERN HEIGHT: H = | Base High Price - Base Low Price |1. The Measured Move Technique (Absolute Height)
The vertical distance between the first swing high and first swing low (the base of the triangle) is measured and added to (or subtracted from) the breakout point:
$$\text{Bullish Target} = \text{Breakout Price} + H$$
$$\text{Bearish Target} = \text{Breakdown Price} - H$$
Concrete Calculation Example: EUR/USD
Assume a symmetrical triangle forms on the daily chart:
- First Swing High (Base Peak): 1.1000
- First Swing Low (Base Trough): 1.0600
- Pattern Height ($H$): $1.1000 - 1.0600 = 0.0400$ (400 pips)
- Price subsequently closes above the upper resistance line at 1.0850:
- Measured Profit Target: $1.0850 + 0.0400 = \mathbf{1.1250}$
2. The Parallel Trendline Technique
An alternative institutional method involves drawing a line parallel to the lower ascending support trendline, starting from the very first peak of the base. This upward-sloping channel line provides a dynamic, time-adjusted price target for bullish breakouts.
Symmetrical Triangle vs. Ascending vs. Descending Triangle
| Triangle Type | Upper Trendline Slope | Lower Trendline Slope | Inherent Bias | Typical Market Psychology |
|---|---|---|---|---|
| Symmetrical Triangle | Downward-Sloping | Upward-Sloping | Bilateral / Neutral (Slight continuation bias) | Complete equilibrium; neither buyers nor sellers hold dominance |
| Ascending Triangle | Flat / Horizontal (Resistance) | Upward-Sloping (Higher Lows) | Bullish | Aggressive buyers stepping in at higher levels against fixed supply |
| Descending Triangle | Downward-Sloping (Lower Highs) | Flat / Horizontal (Support) | Bearish | Aggressive sellers pressing down against a weakening demand floor |
Real-World Institutional Case Study: Bitcoin (BTC/USD) Massive 2020 Symmetrical Coil
Between May and October 2020, following the initial pandemic recovery, Bitcoin (BTC/USD) carved out a pristine 5-month symmetrical triangle consolidation on its weekly chart:
       BITCOIN (BTC/USD) WEEKLY SYMMETRICAL TRIANGLE (2020)

 $12,500 ──┐ (Aug 2020 Peak)
           │\
 $11,500 ──┼─\___  Upper Resistance Line (Lower Highs)
           │     \___
 $10,500 ──┼─────────\───* [ BREAKOUT CLOSE: OCTOBER 2020 ] ──► SURGES TO $64,000
           │        _.-'
  $9,500 ──┼────_.-'  Lower Support Line (Higher Lows)
           │_.-'
  $8,800 ──┴─────────────────────────────────────────────────────────────────
May Jun Jul Aug Sep Oct- The Compression: Bitcoin traded between $12,500 and $8,800, printing consecutive lower highs ($12,480, $11,180) and higher lows ($8,900, $9,800).
- The Volume Signal: Weekly volume dwindled to multi-year lows, and Bollinger Band width reached historic compression levels.
- The Breakout: In late October 2020, institutional capital (led by MicroStrategy and hedge fund allocations) drove a decisive weekly close above the upper resistance line at $10,500 on expanding volume.
- The Result: Applying the measured move ($H = $12,500 - $8,800 = $3,700$), the initial target was $14,200. Bitcoin completely shattered this baseline projection, embarking on a historic parabolic bull market that reached $64,800 by April 2021.
Tactical Trading Strategies: Avoiding False Breakouts
To prevent being trapped by whipsaws and false breakouts in a symmetrical triangle, institutional traders deploy three execution rules:
- Demand Candle Close Confirmation: Never enter on an intraday wick piercing the trendline. Wait for the candlestick (e.g., 4-hour or daily bar) to close decisively outside the boundary line.
- The 3% or 2-ATR Filter: Require the breakout price to clear the trendline by at least 2 times the Average True Range (ATR) or by a minimum percentage threshold before triggering an entry order.
- The Breakout-and-Retest Play: Wait for the initial breakout, followed by a low-volume retracement back to test the former trendline (resistance turning into support). Entering on the confirmed retest offers an exceptional risk-reward ratio.
Frequently Asked Questions
Can a symmetrical triangle break out in the opposite direction of the prior trend?
Yes. While symmetrical triangles resolve in the direction of the prevailing trend approximately 60% of the time, roughly 40% of symmetrical triangles resolve as trend reversals. Traders must treat the pattern as non-directional until a confirmed breakout occurs.
Where should the stop-loss be positioned when trading a symmetrical triangle breakout?
For a bullish breakout, the stop-loss should be positioned just below the most recent swing low formed inside the triangle, or just below the broken upper resistance trendline. Placing the stop inside the triangle ensures that if the breakout fails and price falls back into the coil, losses are capped immediately.
What happens if the price drifts all the way through the apex without breaking out?
If an asset reaches the exact point of the apex without experiencing an explosive breakout, the pattern is deemed invalidated. The converging trendlines lose their structural significance, volatility dies, and the market typically enters a flat, erratic range that should be avoided.
Ready to trade forex?
Open a free demo account with a regulated broker. Practice with virtual funds before risking real money.