Zero-Investment Portfolio
A self-financing trading portfolio constructed by taking long positions financed entirely by short positions of equal market value, resulting in zero net initial capital outlay and serving as the mathematical basis for factor asset pricing models.
What Is a Zero-Investment Portfolio?
A zero-investment portfolio, also referred to in quantitative finance as a self-financing portfolio or dollar-neutral portfolio, is an investment strategy constructed such that the total monetary value of all long positions is exactly offset by the total monetary value of all short positions. Consequently, the net initial equity capital required to establish the strategy equals zero dollars:
$$\text{Net Initial Capital Outlay} = \sum_{i=1}^N V_i = $0.00$$
Where $V_i$ represents the monetary value invested in asset $i$ (positive for long purchases, negative for short sales). In portfolio weighting terms, where weights represent proportions of net worth:
$$\sum_{i=1}^N w_i = 0$$
In financial economics, the zero-investment portfolio serves as the primary mathematical building block for Stephen Ross’s Arbitrage Pricing Theory (APT) and empirical multi-factor asset pricing models, including the Fama-French Three-Factor and Five-Factor models. In practical trading, quantitative hedge funds and statistical arbitrage desks utilize zero-investment structures to harvest relative-value spreads, currency carry premiums, and cross-sectional factor alphas while neutralizing broad market beta.
Theoretical Foundations: APT and Factor Mimicking Portfolios
The conceptual importance of zero-investment portfolios stems from academic asset pricing theory:
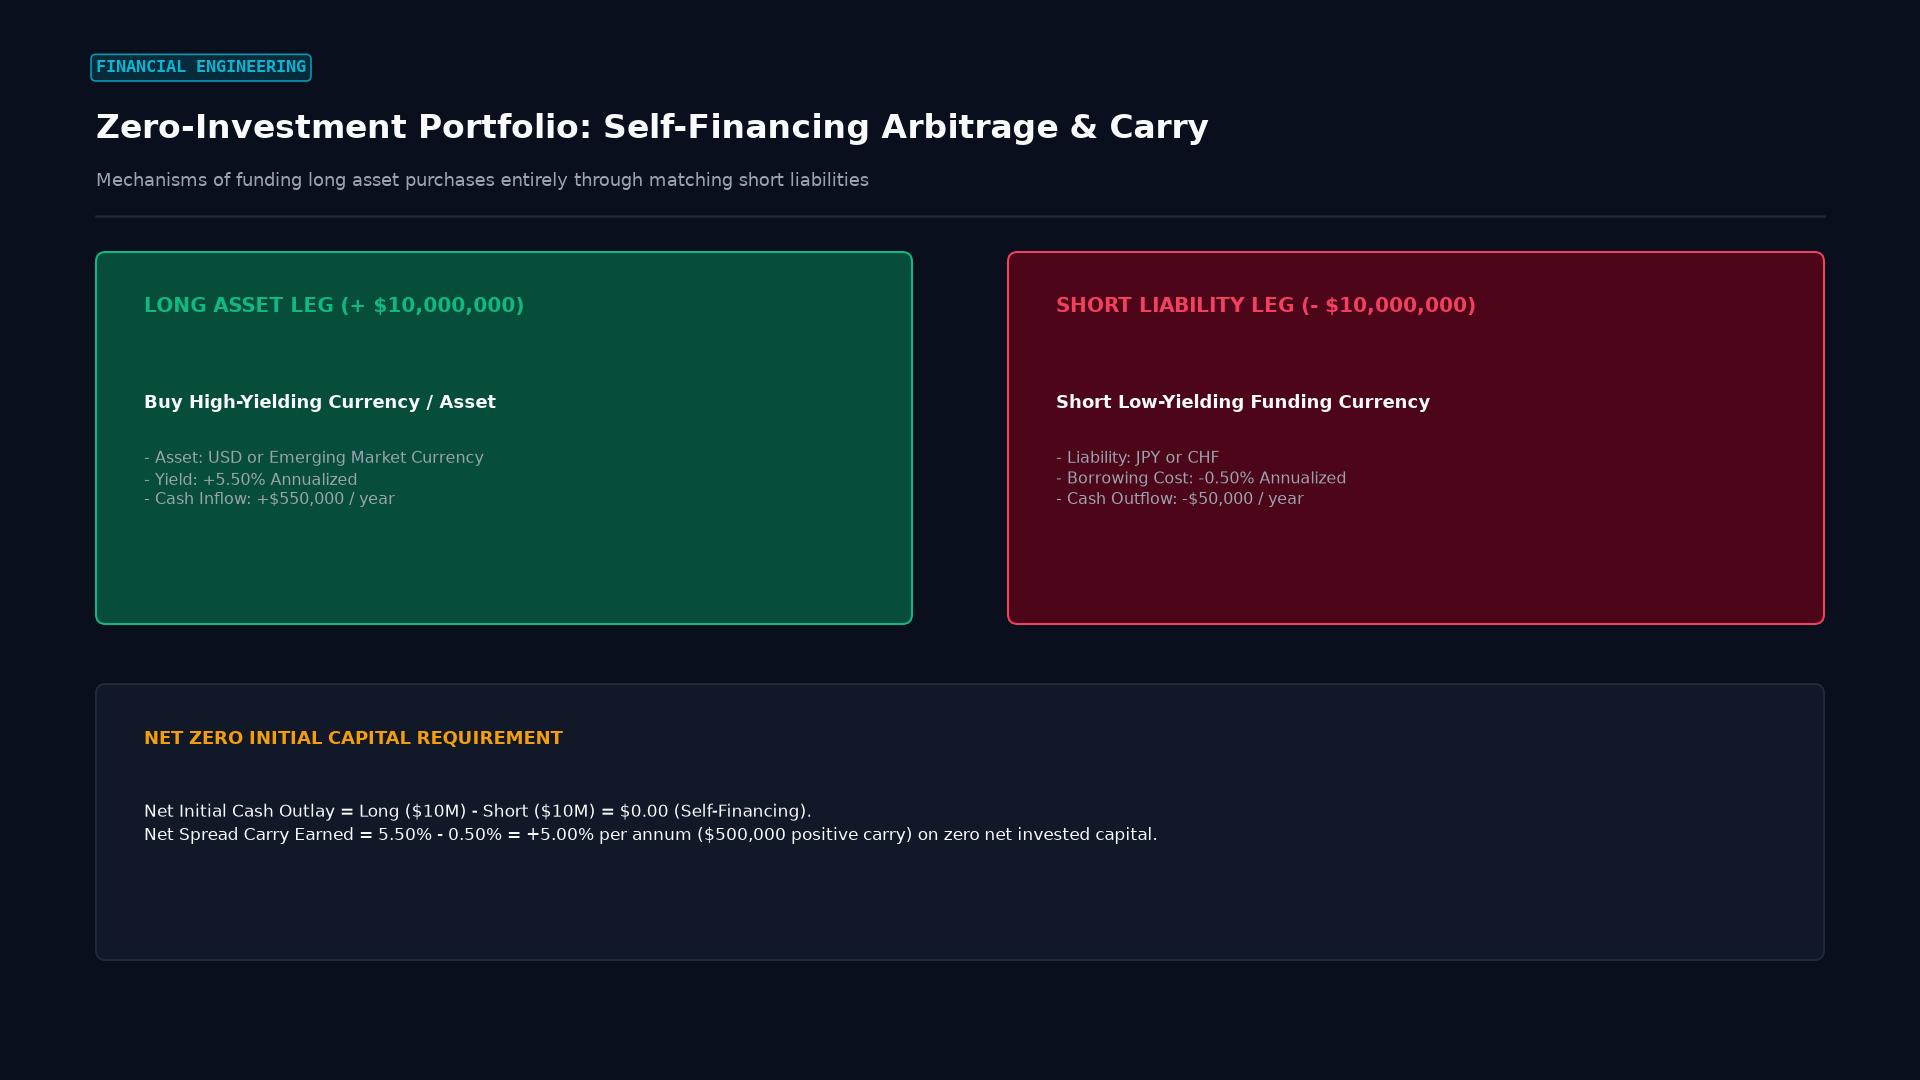 Figure: Financial engineering framework: funding high-yielding long currency assets entirely through short low-yielding liabilities at zero net initial capital.
1. Stephen Ross’s Arbitrage Pricing Theory (APT, 1976)
In classical economics, an arbitrage opportunity is formally defined as a zero-investment portfolio that produces a certain positive return with zero probability of loss and zero net variance. Under the Law of One Price and no-arbitrage conditions, such riskless money-making machines cannot persist in equilibrium. The mathematical absence of profitable risk-free zero-investment portfolios implies that an asset’s expected return must be a linear function of its exposure to systematic macroeconomic risk factors.
2. Fama-French Factor Portfolios
The famous factor premiums discovered by Eugene Fama and Kenneth French are operationalized exclusively as zero-investment factor-mimicking portfolios:
- SMB (Small Minus Big): Long small-cap equities, financed by shorting large-cap equities.
- HML (High Minus Low): Long high book-to-market (value) stocks, financed by shorting low book-to-market (growth) stocks.
- RMW (Profitability Factor: Strong Minus Weak): Long high-operating-profitability firms, shorting weak-profitability firms.
- CMA (Conservative Minus Aggressive): Long conservative-investment firms, shorting aggressive-capex firms.
- WML / UMD (Winners Minus Losers): The Jegadeesh and Titman momentum factor: long 12-month winning stocks, short 12-month losing stocks.
Because these factor benchmarks require zero net capital, their returns represent pure excess returns directly comparable across different market regimes.
Real-World Quantitative Implementation
In professional trading, quantitative desks translate theoretical zero-investment concepts into actionable execution strategies:
               REAL-WORLD TRADING OF ZERO-INVESTMENT PORTFOLIOS

      ┌───────────────────────┼───────────────────────┐
      ▼                       ▼                       ▼
 [Statistical Arbitrage]  [Equity Market-Neutral] [FX Carry Trade Engine]
 Pairs trading on         Long top-ranked stocks, Borrow low-yielding JPY/CHF,
 cointegrated stocks;     short bottom stocks,    invest in high-yielding USD;
 mean-reverting spreads   neutralizing sector beta zero initial FX equity base
1. Statistical Arbitrage and Pairs Trading
A quant desk identifies two historically cointegrated equities in the energy sector (e.g., Chevron and ExxonMobil). When the price ratio diverges beyond two standard deviations from its rolling mean, the desk executes a zero-investment pairs trade:
- Long $5,000,000 of the undervalued stock.
- Short $5,000,000 of the overvalued stock.
- Net Position Value: $$5,000,000 - $5,000,000 = $0.00$.
- When the pricing spread reverts to equilibrium, the desk unwinds both legs simultaneously, capturing the spread profit regardless of whether global crude oil prices rallied or collapsed during the holding window.
2. Foreign Exchange (FX) Currency Carry Trades
In currency markets, carry trades are inherently self-financing zero-investment structures. A trader borrows Japanese Yen (JPY) at an interest rate of 0.25% and immediately sells the JPY to purchase US Dollars (USD), investing the proceeds in US Treasury bills yielding 5.00%. The trader commits zero initial capital of their own, pocketing the positive interest rate differential (the net interest carry).
Theory vs. Reality: Prime Brokerage and Capital Haircuts
While economic textbooks assume that short-sale cash proceeds are freely available to fund long purchases at zero friction, institutional market reality operates differently:
         ACADEMIC ASSUMPTION                       REAL-WORLD REALITY

  Short $10M Stock ──► Receives $10M Cash   Short $10M Stock ──► Prime Broker holds cash
                                                               + Demands 25% Margin Haircut
                                                               │
  Funds $10M Long Purchase Instantly        Investor MUST deposit $2.5M Equity Capital!
In institutional trading desks:
- Collateral Haircuts and Regulation T: Regulatory frameworks (such as US Federal Reserve Regulation T) and prime broker risk models prohibit deploying short proceeds with zero collateral. A hedge fund shorting $10,000,000 of equities must post a margin haircut (typically 15% to 30% under portfolio margin rules).
- Short Borrow Fees: Prime brokers charge annual stock borrow fees to locate and borrow shares. While highly liquid large-cap stocks carry nominal “general collateral” borrow fees of 0.25% to 0.50%, hard-to-borrow equities can demand borrow fees of 10% to 50%+ annualized, eroding trading profits.
- Short Rebate Rates: The cash generated from short sales is held by the prime broker as collateral. Prime brokers pay interest on this cash to institutional clients at the short rebate rate (typically benchmark overnight rate minus a broker spread).
- Short Squeeze Risk: An unhedged rise in the short leg can trigger margin calls, forcing early liquidation at the worst possible market prices.
Performance and Risk Evaluation Metrics
Because the denominator in the standard return calculation ($R = \frac{\text{Profit}}{\text{Initial Investment}}$) is zero, calculating percentage returns for a zero-investment portfolio generates an undefined mathematical division by zero ($\frac{\Delta V}{0}$).
To evaluate performance, quantitative portfolio managers utilize standardized alternative metrics:
- Dollar Return: Measuring absolute dollar profits generated ($\Pi = \text{Long P&L} + \text{Short P&L}$).
- Return on Margin (ROM): Calculating profits relative to the regulatory collateral posted with the prime broker: $$\text{ROM} = \frac{\text{Net Dollar P&L}}{\text{Required Margin Equity}}$$
- Return on Gross Exposure: Normalizing returns against the sum of the absolute values of long and short positions: $$\text{Return on Gross} = \frac{\text{Net Dollar P&L}}{\sum |V_{\text{Long}}| + \sum |V_{\text{Short}}|}$$
- Information Ratio (IR): Dividing the average spread return by the tracking error (standard deviation of the spread returns), quantifying risk-adjusted factor efficiency.
Frequently Asked Questions
Can a retail trader construct a true zero-investment portfolio?
In practice, retail traders cannot construct a true zero-investment portfolio because retail margin accounts require initial equity capital. Under retail margin rules (such as US Regulation T), a retail trader must maintain at least 50% margin equity for short sales and cannot freely use short sale proceeds to buy long shares without posting personal capital. However, traders can execute dollar-neutral long/short strategies using leveraged margin accounts.
How does a zero-investment portfolio differ from a zero-beta portfolio?
A zero-investment portfolio refers to the capital structure of the trade (total long market value equals total short market value, requiring zero net cash). A zero-beta portfolio refers to the market risk sensitivity of the trade (the portfolio return has zero covariance with the broader market benchmark). A portfolio can be zero-investment without being zero-beta (for instance, long $1M of a high-beta stock and short $1M of a low-beta stock).
Why do academic researchers utilize zero-investment portfolios to test market efficiency?
Academic researchers use zero-investment portfolios because they represent pure trading strategies isolated from general market growth. If financial markets are semi-strong form efficient, no zero-investment strategy based on publicly available historical data or accounting ratios should be capable of producing statistically significant positive returns after adjusting for known risk factors and transaction costs.
Ready to trade forex?
Open a free demo account with a regulated broker. Practice with virtual funds before risking real money.