Zig Zag Indicator
A technical analysis overlay that filters out market noise and minor price fluctuations below a specified threshold, connecting significant swing highs and swing lows to clarify structural trends, chart patterns, and wave counts.
Zig Zag Indicator
The Zig Zag indicator is an algorithmic charting tool that eliminates minor price oscillations and intraday market noise, drawing straight line segments between major swing highs and swing lows. By imposing a strict price change filter (measured either in percentage terms, absolute points, or multiples of Average True Range), the indicator isolates macro market structure from random volatility.
In active currency trading, algorithmic pattern recognition, and quantitative research, the Zig Zag overlay serves as a structural foundation. Rather than generating standalone entry or exit signals, it provides an objective visual framework for identifying Elliott Wave sequences, harmonic chart formations, support and resistance levels, and Dow Theory trend transitions.
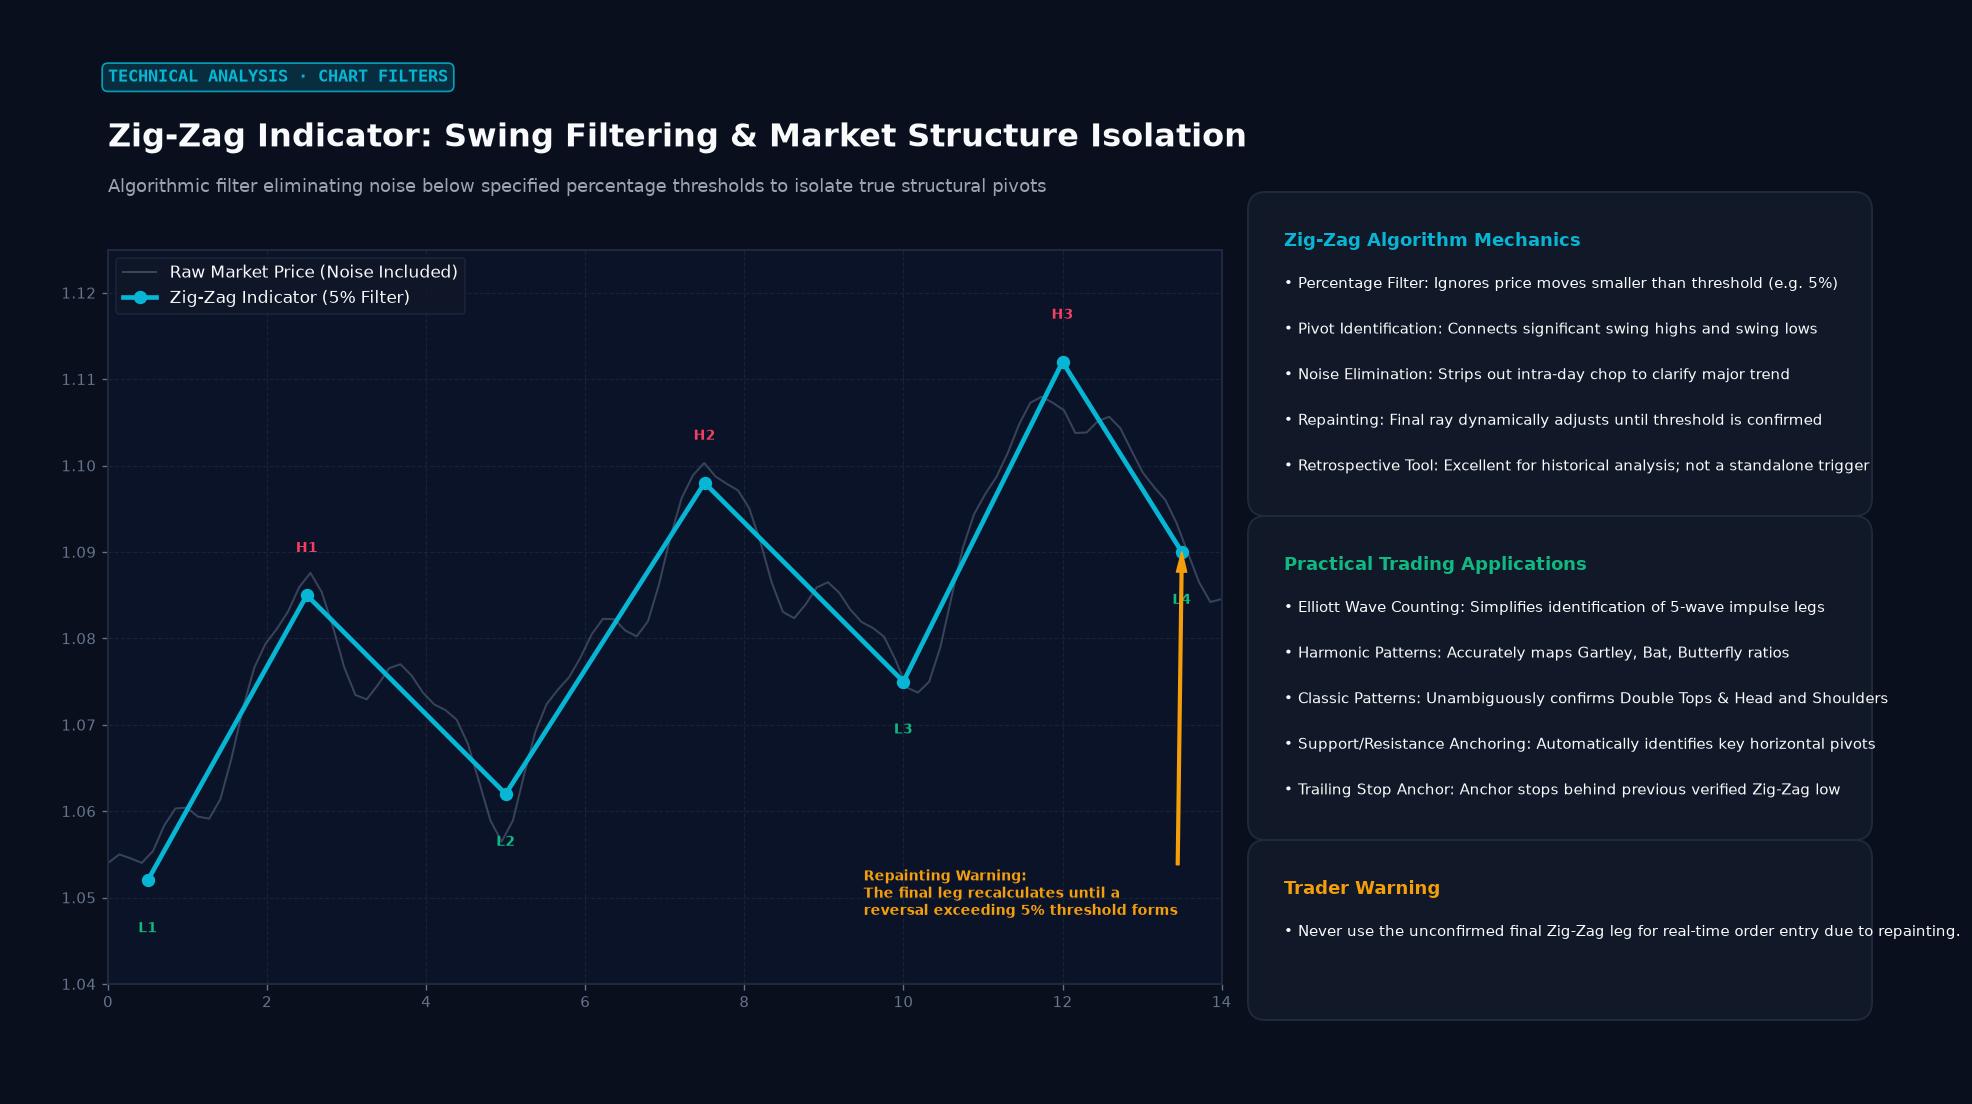 Figure: Algorithmic filter eliminating noise below specified percentage thresholds to isolate true structural pivots
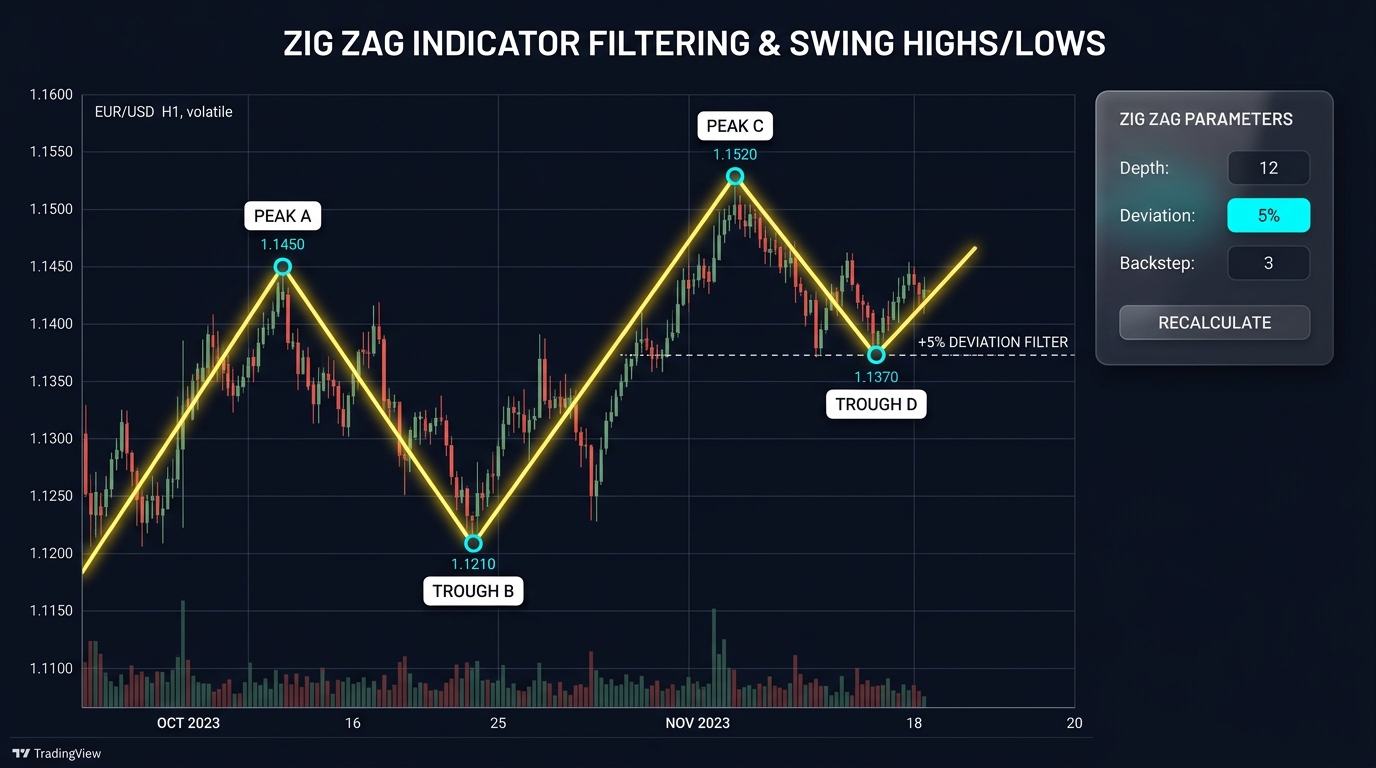
Core Mechanics and Parameter Architecture
The classical Zig Zag algorithm continuously evaluates incoming price bars to detect directional reversals that exceed a predefined threshold. Most modern trading platforms (such as MetaTrader, TradingView, and Bloomberg Terminal) parameterize the indicator through three distinct variables:
+--------------------------------------------------------------------------+
|                  The Three Zig Zag Configuration Pillars                 |
+--------------------------------------------------------------------------+
|  Parameter  | Definition                                                 |
+-------------+------------------------------------------------------------+
|  Depth      | Minimum number of bars evaluated without a conflicting     |
|             | second deviation before establishing a new swing candidate |
|  Deviation  | Minimum percentage price change (or points) required to    |
|             | validate a reversal from a previous swing extreme          |
|  Backstep   | Minimum number of bars that must separate consecutive      |
|             | swing highs and swing lows                                 |
+--------------------------------------------------------------------------+
1. Depth (Default: 12)
Depth specifies the lookback window of price bars across which the algorithm searches for extreme price points. A higher depth value smooths out intermediate fluctuations, highlighting only multi-week or multi-month macroeconomic swings. A lower depth captures short-term intraday cyclicality.
2. Deviation (Default: 5%)
Deviation establishes the hurdle rate for validating a trend change. If the deviation threshold is set to 5%, price must retrace at least 5% against the prevailing leg before the indicator acknowledges a reversal and initiates a new counter-directional segment. Any price retracement of 4.9% or less is ignored as noise, allowing the existing trendline to stretch higher or lower.
3. Backstep (Default: 3)
Backstep acts as a temporal brake. It dictates the minimum number of price bars required between two sequential swing vertices. This prevents the indicator from clustering multiple swing highs or lows in tightly consolidated ranges.
[ Incoming Price Candle Closes ]
               │
               ▼
[ Does Price Exceed Current Swing High/Low? ]
       │                                │
      YES                               NO
       │                                │
       ▼                                ▼
[ Extend Current Leg Higher/Lower ]  [ Does Retracement Exceed Deviation %? ]
                                            │                      │
                                           YES                     NO
                                            │                      │
                                            ▼                      ▼
                             [ Lock Previous Pivot ]     [ Ignore Candle: ]
                             [ Spawn New Counter-Leg ]   [ Noise Filtered ]
The Repainting Reality: Indicator vs. Trading Signal
The most critical operational characteristic of the Zig Zag indicator is that it dynamically repaints its most recent segment.
Until a swing point is confirmed by a completed counter-trend move that satisfies both the Depth and Deviation rules, the terminal end of the current Zig Zag line moves dynamically with every new price bar:
+--------------------------------------------------------------------------+
|                     Dynamic Repainting Mechanics                         |
+--------------------------------------------------------------------------+
|  Bar 100: EUR/USD reaches 1.1000. Zig Zag draws a provisional peak.       |
|  Bar 101: EUR/USD rallies to 1.1050. Zig Zag stretches line to 1.1050.   |
|  Bar 102: EUR/USD spikes to 1.1120. Zig Zag redraws peak at 1.1120.      |
|  Bar 105: EUR/USD falls to 1.0950 (>5% drop). Peak at 1.1120 is locked.   |
|           A new downward leg begins tracking toward 1.0950.              |
+--------------------------------------------------------------------------+
Because of this trailing behavior, attempting to trade directly off the emergence of a new Zig Zag line guarantees devastating losses. The line appears to identify market tops and bottoms with flawless precision in historical hindsight, but during live market conditions, the current pivot point floats until price reverses violently away from it.
Institutional desks use the Zig Zag indicator strictly as an analytical filter to organize historical market structure, never as an execution trigger.
Applications in Advanced Technical Frameworks
When deployed properly to structure completed market data, the Zig Zag overlay powers several sophisticated trading paradigms:
1. Elliott Wave Principle
Elliott Wave analysis requires decomposing price action into five-wave motive trends (Waves 1 through 5) and three-wave corrective cycles (Waves A, B, and C). Subjective human bias often leads novice analysts to mistake minor intraday pullbacks for major sub-waves. By calibrating the Zig Zag deviation parameter to the asset’s typical wave amplitude, analysts isolate genuine structural waves:
                   Elliott Wave 5-Wave Motive Sequence
  Price
    ^
    |                                              Wave 5
    |                                                /\
    |                         Wave 3                /  \
    |                           /\                 /    \
    |                          /  \               /      \
    |            Wave 1       /    \             /        \
    |              /\        /      \   Wave 4  /
    |             /  \      /        \_/───────/
    |            /    \    /
    |           /      \  /  Wave 2
    |          /        \/
    |         /
    +------------------------------------------------------------>
                                                              Time
2. Harmonic Pattern Recognition
Automated algorithms designed to detect complex harmonic formations (such as the Gartley, Bat, Crab, and Butterfly patterns) depend entirely on the Zig Zag indicator. These geometric formations require precise Fibonacci ratios between consecutive swing legs:
- In a classic Bullish Gartley, the retracement of Leg $AB$ relative to Leg $XA$ must equal exactly 61.8%.
- Leg $BC$ must retrace 38.2% to 88.6% of Leg $AB$.
- Leg $CD$ must represent a 78.6% retracement of Leg $XA$.
Automated scanning bots use the confirmed pivot points $(X, A, B, C, D)$ produced by the Zig Zag engine to compute leg lengths and flag high-probability reversal zones.
3. Objective Support and Resistance Mapping
Horizontal price levels where multiple Zig Zag pivots cluster over months or years represent structural support and resistance. Because the indicator ignores sub-threshold noise, horizontal lines drawn through Zig Zag vertices reflect zones where institutional order flow previously exhausted market liquidity.
Parameter Selection Across Asset Classes
Market volatility characteristics vary dramatically across asset classes, requiring customized indicator calibration:
| Asset Class / Instrument | Typical Deviation Setting | Recommended Depth | Analytical Objective |
|---|---|---|---|
| G10 Forex (EUR/USD, USD/JPY) | 0.5% to 1.5% | 8 to 12 bars | Captures macroeconomic session swings without whipsaws |
| Cryptocurrency (BTC/USD, ETH/USD) | 8.0% to 15.0% | 15 to 24 bars | Absorbs extreme intraday volatility and liquidation cascades |
| Equities & Indices (S&P 500) | 3.0% to 5.0% | 10 to 14 bars | Identifies multi-week swing cycles and corporate earnings trends |
| Commodities (Crude Oil, Gold) | 4.0% to 7.0% | 12 to 18 bars | Maps supply-demand geopolitical imbalances |
Integrating Average True Range (ATR)
Rather than hardcoding static percentage deviations, quantitative programmers often build Volatility-Adjusted Zig Zag indicators. In this formulation, the required reversal threshold dynamically scales with the 14-period Average True Range:
$$\text{Reversal Threshold} = k \times \text{ATR}(14)$$
Where $k$ is an adjustable multiplier (typically between 2.0 and 3.5). During high-volatility regimes (such as central bank interest rate decisions), the reversal hurdle expands automatically, preventing the algorithm from fragmenting the chart into meaningless micro-swings.
Systematic Trading Workflow: Combining Zig Zag with Confirming Signals
To trade market reversals safely without falling victim to repainting, traders combine historical Zig Zag pivots with non-repainting momentum indicators:
[ Zig Zag Forms Potential New Swing Pivot ]
                      │
                      ▼
[ Price Reaches Major Higher-Timeframe Support / Resistance Level ]
                      │
                      ▼
[ Check Momentum Oscillators: RSI / MACD Divergence ]
       │                                │
      YES                               NO
       │                                │
       ▼                                ▼
[ Monitor Break of Market Structure (BOS) ] [ Stand Down: Pivot Unconfirmed ]
       │
       ▼
[ Enter Trade on Confirmed Reversal Candle ]
[ Place Stop-Loss Beyond Zig Zag Pivot Extreme ]- Step 1: Structural Context. The trader observes that a provisional Zig Zag swing low is developing precisely at a multi-month support shelf.
- Step 2: Momentum Confirmation. The trader inspects the Relative Strength Index (RSI). While price is printing an equal or lower low, the RSI exhibits clear bullish divergence, indicating exhaustion of selling pressure.
- Step 3: Market Structure Break (BOS). Instead of buying blindly at the provisional low, the trader waits for intraday price action to break above the most recent lower high on a shorter timeframe chart (such as the 15-minute chart).
- Step 4: Execution. The trade is executed on the retest of the broken level, with a protective stop-loss placed 5 to 10 pips beyond the verified Zig Zag swing low.
Limitations and Common Analytical Errors
Using the Zig Zag indicator without understanding its mathematical constraints introduces substantial risk:
- Look-Ahead Bias in Quantitative Backtests: The most pervasive trap in algorithmic development occurs when backtesting systems query the Zig Zag array without lagging the data. Because historical arrays contain the perfected, non-repainted pivot dates, backtests report spectacular, unrealistic returns by buying at exact bottoms and selling at exact tops. Live algorithmic models must evaluate only fully locked pivots.
- Lagged Pivot Confirmation: By the time a Zig Zag pivot is locked and mathematically guaranteed not to repaint, price has already moved by the full deviation threshold (e.g., 5% or 300 pips). Entering trades at the exact moment of confirmation sacrifices substantial profit potential and degrades risk-to-reward ratios.
- Ranging Market Degradation: During prolonged sideways market regimes with tight trading bands, static percentage thresholds either generate zero swings (if the threshold is too wide) or produce rapid whipsaws (if set too tight).
Frequently Asked Questions
Can the Zig Zag indicator be used for automated automated trade entries?
Not as a standalone trigger. Because the indicator repaints the current leg until price moves beyond the deviation threshold, opening trades upon the appearance of a new vertex results in continuous false entries. It should be used exclusively to define market structure, anchor Fibonacci tools, or feed geometric coordinates into harmonic pattern recognition algorithms.
How does the Zig Zag indicator eliminate market noise?
It establishes a strict minimum price change filter. Any price movement that fails to meet the percentage, point, or ATR threshold is treated as irrelevant volatility and omitted from the chart. The indicator connects only the price points that exceed the threshold, presenting an uncluttered view of major swings.
What is the difference between Depth and Deviation?
Deviation represents the minimum price distance (measured in percentage or pips) required to reverse the direction of a line segment. Depth represents the minimum lookback period (measured in price bars) over which the algorithm searches for high or low candidates, preventing the generation of overlapping pivots during rapid price spikes.
Ready to trade forex?
Open a free demo account with a regulated broker. Practice with virtual funds before risking real money.