What Is the US Dollar Index (DXY/USDX)?
A complete guide to the US Dollar Index (DXY): its composition, how to read it, what movements mean for major forex pairs, and how traders use it as a market sentiment tool.
Any trader who works with USD pairs, particularly EUR/USD, regularly hears references to “DXY” or the “dollar index.” It is the single most widely referenced benchmark for overall USD strength or weakness, and understanding it gives you a useful macro perspective that individual pair charts don’t provide on their own.
What the US Dollar Index Is
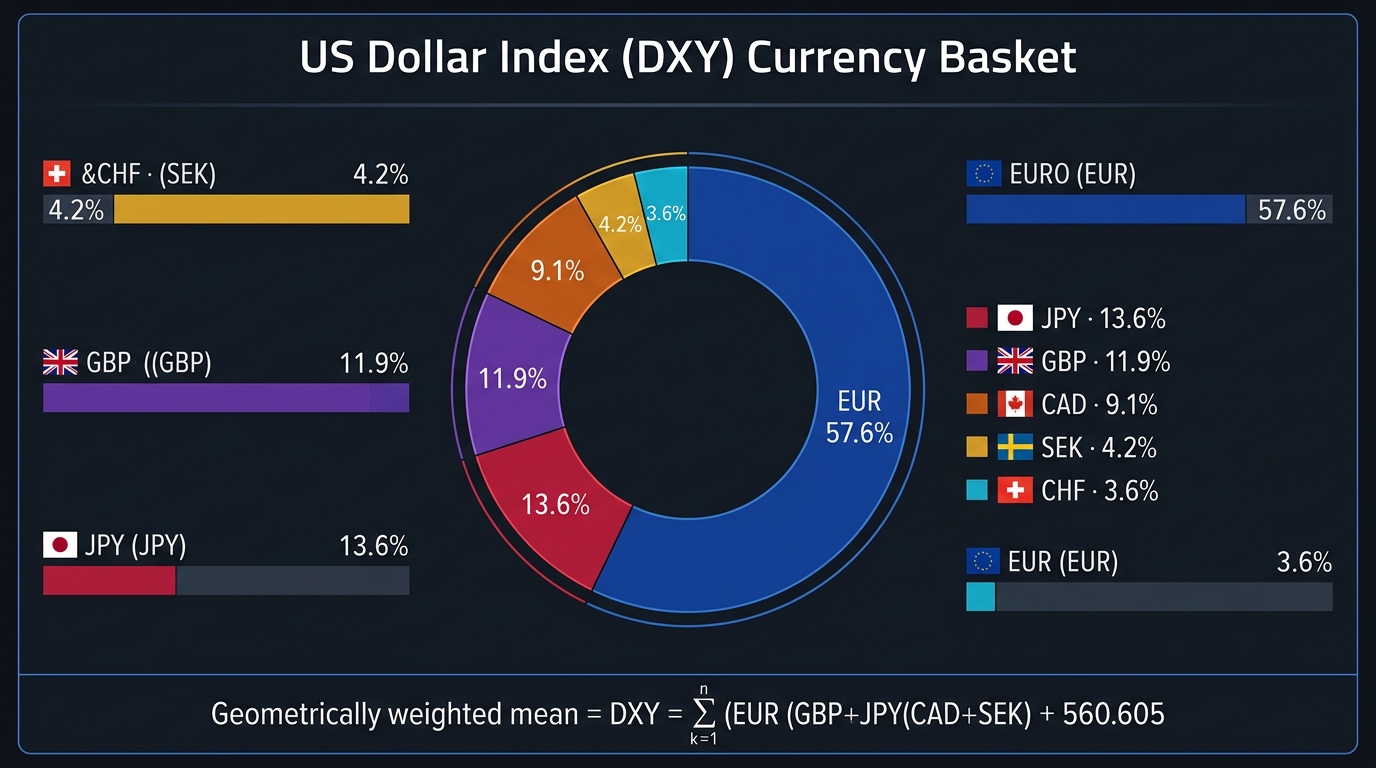
The US Dollar Index (USDX, commonly called DXY) measures the value of the US Dollar against a basket of six major foreign currencies. It was established in 1973, shortly after the Bretton Woods system of fixed exchange rates was abandoned, and started with a base value of 100.
The basket and its weights are:
| Currency | Weight |
|---|---|
| Euro (EUR) | 57.6% |
| Japanese Yen (JPY) | 13.6% |
| British Pound (GBP) | 11.9% |
| Canadian Dollar (CAD) | 9.1% |
| Swedish Krona (SEK) | 4.2% |
| Swiss Franc (CHF) | 3.6% |
The heavy EUR weighting is the first thing to understand about this index. The Euro, which didn’t exist when the index was created, replaced the legacy European currencies (Deutsche Mark, French Franc, Italian Lira, and others) in 1999 and inherited their combined weight. This means EUR/USD movements account for roughly 57-58% of any DXY move.
Although only 6 currency symbols appear, the Euro represents 16 member countries, so the dollar is effectively benchmarked against 21 nations.
How to Read DXY Values
The index started at 100 in 1973. All readings are relative to that baseline:
- A DXY reading of 110 means the USD has strengthened 10% relative to the basket since 1973.
- A reading of 85 means the USD has weakened 15% from the 1973 baseline.
- A reading of 100 means it’s trading at its original baseline value.
In practice, traders care less about the absolute level and more about the direction and momentum. A DXY rising from 102 to 106 over a few weeks signals broad USD strength across most major pairs. A DXY falling from 106 to 100 signals broad USD weakness.
Recent context: DXY reached historic highs above 114 in late 2022 during the Fed’s aggressive rate hiking cycle, a level not seen since 2002. It has typically traded in the 90-110 range through most of the 2010s and early 2020s.
DXY and Its Direct Relationship to Forex Pairs
Because DXY measures USD against other currencies, it has a predictable directional relationship with the major pairs:
Inverse relationship (DXY up = pair down):
- EUR/USD — strongest inverse relationship due to 57.6% EUR weighting
- GBP/USD
- AUD/USD (indirect; AUD is not in the basket but often tracks)
- NZD/USD (similar indirect relationship)
Direct relationship (DXY up = pair up):
- USD/JPY
- USD/CHF
- USD/CAD
EUR/USD has the tightest inverse correlation with DXY. On most days, if DXY rises 0.5%, EUR/USD falls by a similar proportion. This makes DXY particularly useful as a confirmation tool when trading EUR/USD. If your analysis says EUR/USD should rise, check whether DXY is showing USD weakness. When both align, the trade has better support.
How Traders Use DXY in Practice
Confirmation of USD direction: Before entering a USD-related trade, glance at the DXY chart. If DXY is trending upward and you’re looking to sell a USD pair (implying USD weakness), you’re trading against the broader trend. That doesn’t make it wrong, but it deserves extra scrutiny.
Divergence identification: If EUR/USD is falling while DXY is flat or also falling, something EUR-specific is driving the pair lower rather than broad USD strength. That divergence might indicate a European economic story (ECB dovish shift, political risk) that creates a trade opportunity distinct from a USD play.
Macro trend context: The DXY’s monthly chart shows multi-year USD cycles. The dollar spent years in a broadly weak trend (2002-2008), then strengthened through 2015, weakened through 2018, and strengthened dramatically in 2022. Knowing which phase of this cycle the dollar is in helps you weight your directional bias for any USD pair over a medium-term horizon.
Support and resistance levels: Technical traders apply standard support, resistance, trendlines, and moving averages to the DXY chart. Key DXY levels at round numbers (100, 105, 110) often coincide with reactions in EUR/USD and other major pairs. When DXY tests a major resistance level, EUR/USD may be simultaneously testing a major support, which can provide confluence for reversal setups.
Limitations of the DXY
The basket composition is the index’s biggest limitation for modern trading purposes. It was designed in 1973 and has not been substantially rebalanced since. The result is a dollar index dominated by European currencies (57.6% EUR + 11.9% GBP + 3.6% CHF = 73.1%) with essentially no representation from Asian emerging market currencies (CNY, INR, KRW), which represent some of the most important US trading relationships in the 21st century.
A rising DXY can therefore coexist with a weakening USD against the Chinese Yuan or other Asian currencies that trade intensely with the US economy. For traders focused on those pairs, DXY is a less relevant indicator.
Some traders prefer the Federal Reserve’s Trade Weighted Dollar Index (sometimes called the “Broad Dollar Index”), which includes a much wider range of currencies weighted by actual trade volumes. This is available on the St. Louis Fed FRED database and gives a more representative picture of overall USD value.
DXY as a Market Sentiment Tool
Beyond its direct relationship with forex pairs, the DXY often acts as a broad risk sentiment indicator. During global financial stress, investors tend to buy USD as a safe haven, which pushes DXY higher. During global risk-on periods, USD weakens as capital flows to higher-yielding or growth-sensitive assets, pushing DXY lower.
Watching DXY alongside other risk indicators (VIX equity volatility index, gold prices, JPY movements) gives you a richer picture of whether market conditions are risk-on or risk-off, which in turn helps you assess the environment for any trade you’re considering.
Key Takeaways
- The DXY measures USD against a basket of 6 currencies, heavily weighted toward EUR (57.6%).
- The base value is 100 (set in 1973); readings above indicate USD strength, below indicate weakness.
- EUR/USD has the strongest inverse correlation with DXY due to the EUR’s basket dominance.
- Use DXY as a confirmation tool and for detecting divergences between USD-pair behavior and broad USD strength.
- The basket is outdated (no Asian emerging market currencies), limiting DXY’s relevance for some currency pairs.
- DXY also functions as a macro risk sentiment barometer — rising DXY often indicates risk-off, falling DXY often signals risk-on.
Continue this module: What Are Currency Correlations? | Forex Markets and Global Equity Markets

Ready to Practice This Strategy?
Test what you learned on a free, risk-free demo account before risking real money.