Elliott Wave Five-Wave Impulse Pattern: Detailed Breakdown
The five-wave impulse is the building block of Elliott Wave Theory. Learn the character, Fibonacci relationships, and trading opportunity of each wave in the impulse sequence.
The five-wave impulse pattern is the primary directional sequence in Elliott Wave Theory. Each of the five waves has a distinct character, typical Fibonacci relationship to adjacent waves, and a specific opportunity for traders who can correctly identify where the count currently sits.
This lesson assumes you’ve read the Elliott Wave Theory overview and understand the basic impulse-correction structure.
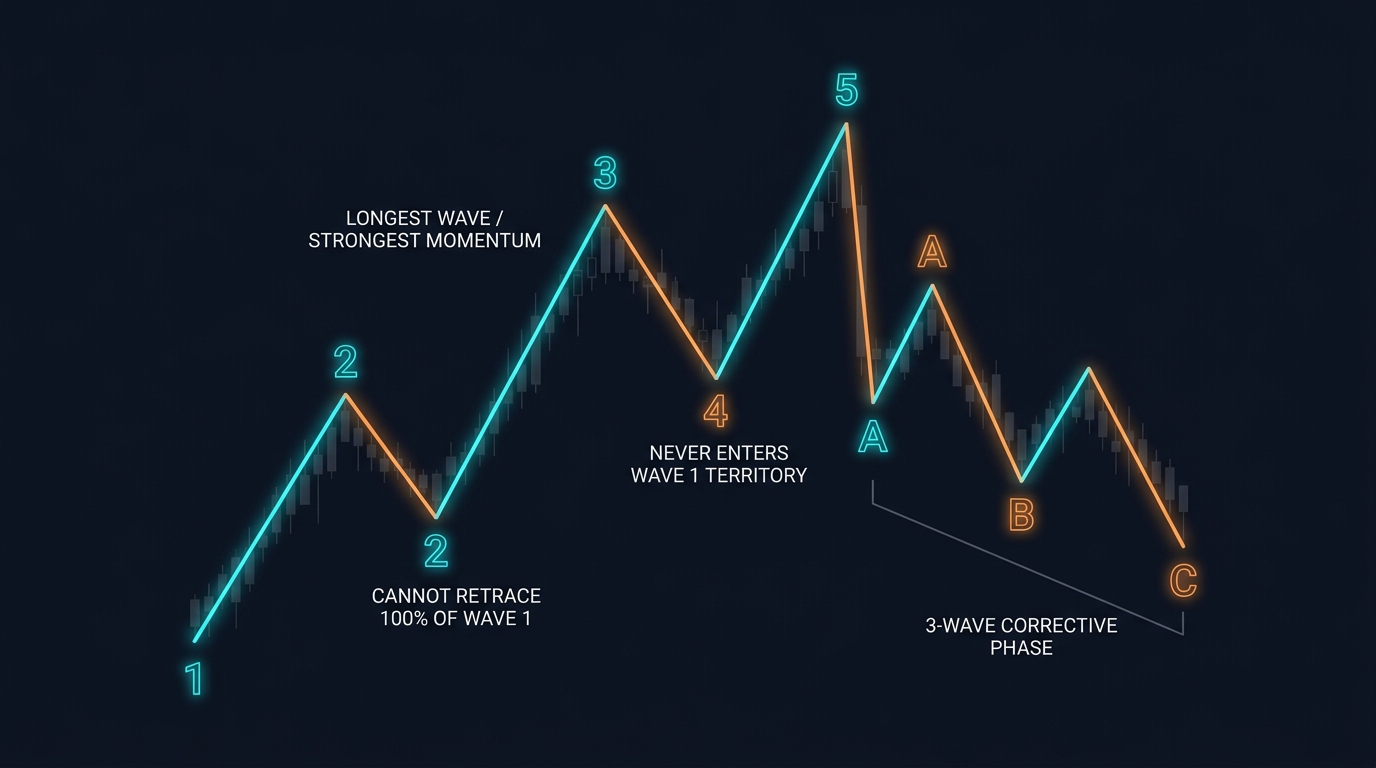
The Five Waves: Character by Wave
Wave 1 — The False Start
Character: Wave 1 typically emerges from the end of a previous downtrend (in a bull market). Most market participants are still bearish — they view the initial move as a temporary bounce. Volume may be moderate to low.
Common Fibonacci target: None defined precisely — Wave 1 sets the baseline for subsequent measurements.
Trading implication: Wave 1 is the hardest to identify in real time. It often looks like just another counter-trend bounce. Most traders miss it entirely. This is acceptable — Wave 3 is the better opportunity.
Wave 2 — The “It’s Over” Wave
Character: Wave 2 corrects a significant portion of Wave 1. Bearish sentiment returns. Many participants who bought Wave 1 sell in frustration. Price looks like it’s resuming the prior downtrend.
Rules: Wave 2 CANNOT retrace 100% or more of Wave 1. A full retracement invalidates the bullish wave count.
Common Fibonacci retracement levels:
- 50% of Wave 1 (frequent)
- 61.8% of Wave 1 (most common)
- 78.6% of Wave 1 (deep but valid)
Pattern: Wave 2 most often forms a simple zigzag (ABC) correction.
Trading implication: This is one of the best entry points in Elliott Wave trading — entering the expected Wave 3 when Wave 2 appears complete. The 61.8% retracement zone of Wave 1, combined with bullish momentum divergence and a price action reversal signal, provides a high-probability long entry.
Wave 3 — The Strongest Wave
Character: The strongest, most extended move in the sequence. By Wave 3, the trend is widely recognized. Institutional participation increases. Volume typically peaks during Wave 3. Breakouts through previous highs attract momentum buyers.
The wave 3 rule: Wave 3 CANNOT be the shortest of the three impulse waves (Waves 1, 3, and 5). In practice, Wave 3 is usually the longest — often 161.8% to 261.8% of Wave 1.
Common Fibonacci extensions from Wave 2 low:
- 161.8% of Wave 1 (most common target)
- 200% of Wave 1
- 261.8% of Wave 1 (in very strong trends)
Trading implication: Wave 3 is the primary target for Elliott Wave traders. Once Wave 2’s correction completes at the Fibonacci zone, a long entry targeting the 161.8% extension captures the highest-momentum portion of the impulse. This is where you want to be fully positioned.
Wave 4 — The Consolidation
Character: A corrective wave against the trend. Unlike Wave 2 (which is often sharp and deep), Wave 4 tends to be shallow and sideways — a consolidation rather than a pullback. It often takes the form of a triangle pattern.
The Wave 4 rule: Wave 4 cannot enter Wave 1’s price territory. If it does, the wave count is incorrect.
Common Fibonacci retracement of Wave 3:
- 23.6% (shallow correction — common in strong trends)
- 38.2% (standard Wave 4 retracement)
- Rarely 50%+ (suggests Wave 4 may be mislabeled)
Wave 4 character contrast with Wave 2:
| Feature | Wave 2 | Wave 4 |
|---|---|---|
| Typical depth | Deep (50–78.6%) | Shallow (23.6–38.2%) |
| Typical pattern | Zigzag | Triangle / Flat |
| Typical duration | Shorter | Longer (takes more time) |
| Sentiment | Fear and doubt | Boredom; sideways |
Trading implication: Wave 4 provides a secondary entry opportunity — less ideal than Wave 2 but valid. Entry at the 38.2% retracement of Wave 3 (if confirmed with price action), targeting Wave 5.
Wave 5 — The Final Push
Character: The last move in the impulse direction. Often narrower than Wave 3 in terms of market participation. Typically accompanied by divergence in momentum indicators — price makes a new high while RSI or MACD makes a lower high. This divergence signals exhaustion.
Common Fibonacci relationships:
- Equal to Wave 1 in length (most common)
- 61.8% of Wave 1 length (truncated Wave 5 — a warning sign)
- 161.8% of Wave 1 (extended Wave 5 — occurs in very strong trends)
Truncated Wave 5: When Wave 5 fails to exceed Wave 3’s high (bull market), it signals that the prior trend has been unusually strong and exhaustion is near. The subsequent ABC correction from a truncated Wave 5 is often rapid and deep.
Trading implication: Wave 5 entries carry more risk than Wave 3 because:
- The end of Wave 5 = end of the entire impulse = beginning of a major ABC correction
- Timing the exact end of Wave 5 is difficult
- Momentum divergence may appear but persist for several waves before the reversal
Better approach: Use Wave 5 to identify the approaching end of the impulse and prepare for the subsequent Wave A short entry (beginning of the ABC correction), rather than chasing Wave 5 itself.
The Complete Wave Structure: Entry Opportunities Ranked
| Entry | Wave | Quality | Risk |
|---|---|---|---|
| Wave 2 completion → Wave 3 entry | Best | Highest | Stop below Wave 1 start |
| Wave 4 completion → Wave 5 entry | Secondary | Good | Stop below Wave 4 low |
| Wave 5 divergence → Wave A short | Advanced | Good | Stop above Wave 5 high |
| Wave 1 identification | Difficult | Lower | Wave 1 still forming |
Key Takeaways
- Wave 1: the initial move, often unrecognized; sets the baseline
- Wave 2: corrects 50–78.6% of Wave 1; provides the highest-quality entry for Wave 3
- Wave 3: the longest, strongest wave (minimum 161.8% of Wave 1); institutional-driven momentum; the primary trade target
- Wave 4: shallow correction (typically 23.6–38.2% of Wave 3); often a triangle; cannot enter Wave 1’s territory
- Wave 5: final push with momentum divergence; carries reversal risk; better to position for the subsequent Wave A decline
- The highest-probability Elliott Wave trade: entering at Wave 2’s completion (at the 61.8% Fibonacci retracement of Wave 1) and targeting the 161.8% extension for Wave 3
Previous: Elliott Wave Theory Overview
Next: Three-Wave ABC Correction
Related: Fibonacci Retracement

Ready to Practice This Strategy?
Test what you learned on a free, risk-free demo account before risking real money.