Three-Wave ABC Correction: How to Trade Elliott Wave Corrections
After a five-wave impulse, markets correct in a three-wave ABC pattern. Learn the three correction subtypes, how to measure Wave C targets, and the highest-probability trade setups that emerge from ABC completions.
After a five-wave impulse completes, markets enter a corrective phase. Elliott Wave Theory proposes that corrections always unfold in three waves labeled A, B, and C. Understanding how corrections behave — their internal structure, depth, and duration — provides the analytical framework for two distinct trading opportunities: trading with the correction and trading the resumption of the main trend after correction completes.
This lesson continues from the Five-Wave Impulse Pattern and Elliott Wave Theory overview.
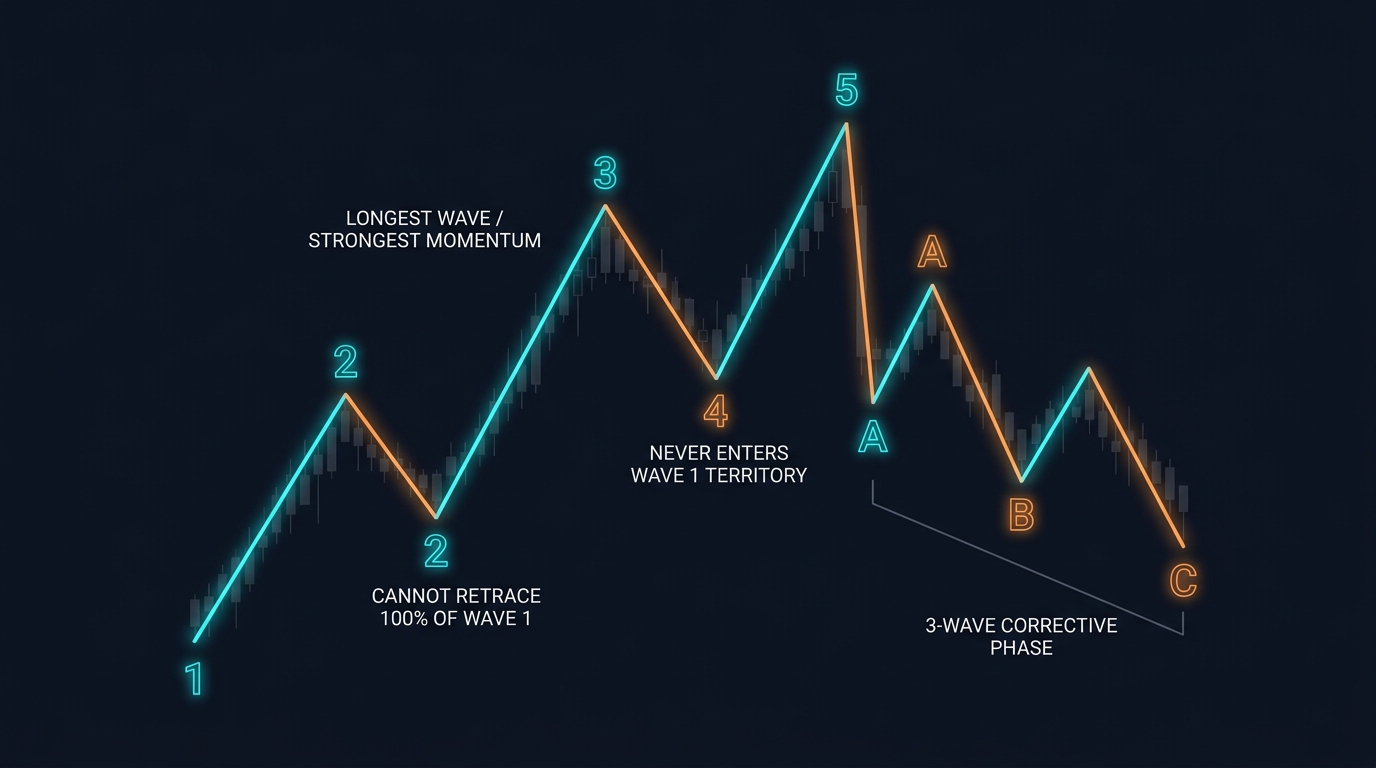
The ABC Structure
In a bull market, after the five-wave impulse completes at the Wave 5 high, price begins its corrective sequence:
Wave A: First move against the main trend. Many participants view it as a temporary pullback within the ongoing trend. May look impulsive (five sub-waves) or corrective (three sub-waves).
Wave B: A partial retracement back toward Wave 5’s high. Creates the false impression that the main uptrend is resuming. This is a trap — Wave B is a counter-trend bounce within the correction.
Wave C: The final corrective move. Often as long as or longer than Wave A. Completes the full correction before the main trend resumes.
The Three Correction Subtypes
Not all ABC corrections look the same. Three main variants appear in forex:
Zigzag (5-3-5 Structure)
Internal structure: Wave A = 5 sub-waves; Wave B = 3 sub-waves; Wave C = 5 sub-waves.
Character: A sharp, deep correction. Wave B retraces only 38.2–61.8% of Wave A. Wave C is typically equal to Wave A or extends to 161.8% of Wave A.
When it appears: Most commonly as Wave 2 of an impulse (the sharp Wave 2 correction). Also appears as Wave A in complex corrections.
Fibonacci targets for Wave C:
- C = A (100% of Wave A) — most common
- C = 161.8% of Wave A — extended zigzag
Flat (3-3-5 Structure)
Internal structure: Wave A = 3 sub-waves; Wave B = 3 sub-waves; Wave C = 5 sub-waves.
Character: Sideways correction. Wave B retraces nearly all of Wave A — often 90–100% of A. The correction doesn’t make much downward progress.
Variants:
- Regular Flat: Wave C ends near the Wave A low; B retraces ~90% of A
- Expanded Flat: Wave B exceeds Wave A’s start; Wave C extends beyond Wave A’s low
- Running Flat: Wave B exceeds Wave A’s start but Wave C doesn’t reach Wave A’s low (rare; signals very strong main trend)
When it appears: Most commonly as Wave 4 (the shallow, sideways consolidation). Also appears as complex Wave B.
Triangle (3-3-3-3-3 Structure)
Internal structure: Five three-wave sub-waves (labeled A-B-C-D-E), each smaller than the last, forming a contracting or expanding shape.
Character: A contracting triangle shows price making lower highs and higher lows — converging toward a point. An expanding triangle shows price making higher highs and lower lows.
Key feature: Triangles are only found in specific wave positions:
- Wave 4 of an impulse (most common)
- Wave B of a zigzag
- Final wave (Wave X) of a complex correction
After a contracting triangle completes, the next wave (typically Wave 5) tends to be quick, sharp, and approximately equal in length to the widest part of the triangle.
Comparing the Three Correction Types
| Feature | Zigzag | Flat | Triangle |
|---|---|---|---|
| Internal structure | 5-3-5 | 3-3-5 | 3-3-3-3-3 |
| Correction depth | Deep | Shallow | Sideways |
| Wave B retracement of A | 38.2–61.8% | 90–100% (or more) | N/A |
| Duration | Shorter | Longer | Longest |
| Most common wave position | Wave 2, Wave A | Wave 4, Wave B | Wave 4, Wave B |
| Post-correction momentum | Often sharp | Moderate | Quick thrust |
Fibonacci Targets for ABC Corrections
The most reliable price target for Wave C is based on the relationship to Wave A:
| Wave C Target | Description | Common? |
|---|---|---|
| C = A (100%) | Wave C equals Wave A in length | Most common |
| C = 61.8% of A | Truncated Wave C | Signals very strong main trend |
| C = 161.8% of A | Extended Wave C | Deeper correction; common in flat |
| C = 261.8% of A | Extended flat scenario | Less common; major correction |
For a zigzag: The most common outcome is Wave C equal to Wave A, providing a precise price target for potential reversal and re-entry into the main trend.
Trading Setups From ABC Corrections
Setup 1: Wave C Completion → Main Trend Re-Entry
The highest-probability Elliott Wave trade: entering the new impulse at Wave C’s completion.
| Step | Action |
|---|---|
| 1. Identify five-wave impulse | Clear 5-wave structure on the daily or 4H chart |
| 2. Track the ABC correction | Wave A decline; Wave B partial bounce; Wave C decline beginning |
| 3. Calculate Wave C target | C = 100% of A from Wave B’s high |
| 4. Wait for reversal signal | Bullish price action at the C target zone (rejection candle, engulfing) |
| 5. Confirmation | RSI or MACD bullish divergence at Wave C low |
| 6. Entry | Long at next candle open |
| 7. Stop | Below Wave C low (if this breaks, count was wrong) |
| 8. Target | 161.8% extension of the new Wave 1 (Wave 3 target) |
Setup 2: Trading Wave C Directly
In a strong, identifiable ABC correction, Wave C can also be traded directly (shorting from Wave B’s high toward Wave C’s target):
| Step | Action |
|---|---|
| 1. Identify Wave B completion | Wave B retraces approximately 61.8% of Wave A (zigzag) |
| 2. Wave B shows rejection | Bearish candle at the B high; momentum divergence |
| 3. Entry | Short at Wave B’s high |
| 4. Stop | Above Wave B high (invalid if breached significantly) |
| 5. Target | Wave C = Wave A projection from Wave B high |
This setup works when the Wave B bounce is clear and the Wave A size gives a precise Wave C target.
Key Takeaways
- ABC corrections unfold in three waves: Wave A (first counter-trend move), Wave B (partial retracement back), Wave C (final corrective move, often equal to Wave A)
- Three correction subtypes: Zigzag (5-3-5, sharp and deep), Flat (3-3-5, sideways), Triangle (3-3-3-3-3, contracting toward a breakout point)
- Most common Wave C target: 100% of Wave A’s length measured from Wave B’s high/low
- The highest-probability trade is entering the new impulse when Wave C completes at its Fibonacci target zone, confirmed by price action and momentum divergence
- Wave B is the “trap” — it mimics the main trend’s resumption; don’t mistake a Wave B bounce for genuine trend continuation
- Triangles in Wave 4 signal an imminent Wave 5 thrust — the thrust length is approximately equal to the triangle’s widest point
Previous: Five-Wave Impulse Pattern
Related: Fibonacci Retracement | Elliott Wave Theory

Ready to Practice This Strategy?
Test what you learned on a free, risk-free demo account before risking real money.