Triangle Chart Patterns in Forex Trading
A complete guide to symmetric, ascending, and descending triangle patterns in forex: how to identify them, trade the breakout, set profit targets, and avoid false breakouts.
Triangle patterns are among the most reliable continuation formations in technical analysis, and they appear on forex charts with regularity across every time frame. They form because price is consolidating after a directional move, compressing into a tighter and tighter range as buyers and sellers reach temporary equilibrium. Eventually, one side wins. The breakout from a triangle often produces a fast, impulsive move that can be traded with clear entry, stop, and target levels.
There are three types of triangle patterns worth knowing: symmetric, ascending, and descending. Each has different implications and slightly different trading rules.
Symmetric Triangles
A symmetric triangle forms when price makes a series of lower highs and higher lows, creating two converging trendlines that meet at roughly equal angles. Neither buyers nor sellers are winning. The market is coiling.
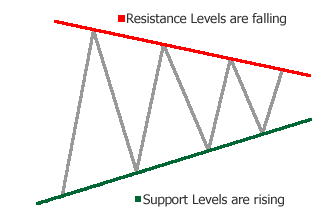
The symmetric triangle is a neutral continuation pattern. It does not predict direction by itself. What it predicts is that the consolidation will eventually resolve, and when it does, the breakout direction will likely continue the move that preceded the triangle.
Identifying a valid symmetric triangle:
- At least two touches on each trendline (four total contact points minimum)
- Each swing high is lower than the previous high
- Each swing low is higher than the previous low
- Volume typically diminishes as the pattern develops and spikes on the breakout
Trading the breakout:
Wait for price to close decisively beyond one of the trendlines. A single candlestick touching the line without closing through it is not a breakout. You want a candle body closing clearly outside the triangle boundary.
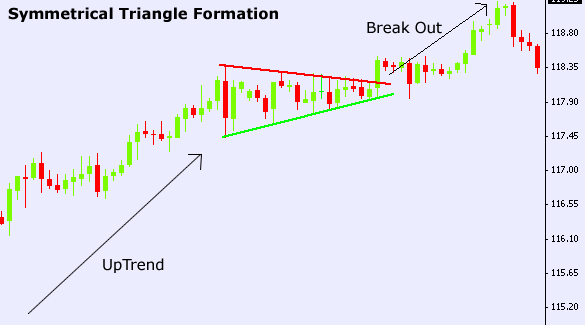
Once the breakout candle closes, enter in the direction of the break. Your stop goes inside the triangle, just beyond the opposite trendline or the last swing within the pattern. The profit target is measured by taking the widest vertical distance of the triangle at its left edge and projecting that distance from the breakout point.
False breakouts are the symmetric triangle’s main hazard. Price can pierce a trendline briefly before reversing back inside the triangle. This is especially common on the first breakout attempt. Experienced traders either wait for a retest of the broken trendline as new support or resistance, or they use volume as confirmation — real breakouts tend to come on notably higher than average volume.
Ascending Triangles
An ascending triangle forms when price makes a series of higher lows while also bumping against the same horizontal resistance level repeatedly. The rising lower trendline shows buyers getting more aggressive with each pullback, while the flat upper line represents a level where sellers have consistently appeared.
This is a bullish pattern. Buyers are absorbing all the selling at the resistance level progressively, as evidenced by the fact that each pullback is shallower than the last. When the resistance level finally gives way, buyers typically overwhelm the remaining sellers in a clean upside breakout.
Trading the ascending triangle:
- Entry: on a close above the flat resistance line
- Stop: below the most recent higher low within the pattern, or below the rising lower trendline
- Target: height of the widest part of the triangle projected upward from the breakout level
The ascending triangle can also break to the downside, though this is the less common outcome. A close below the rising lower trendline signals pattern failure and should prompt an immediate exit.
Descending Triangles
The descending triangle is the mirror image of the ascending pattern. Price makes a series of lower highs while testing the same horizontal support level repeatedly. This is a bearish continuation pattern. Sellers are becoming more aggressive with each rally while buyers keep defending the same support floor.
When that floor gives way, the result is usually a fast breakdown move.
Trading the descending triangle:
- Entry: on a close below the flat support line
- Stop: above the most recent lower high within the pattern
- Target: height of the widest part of the triangle projected downward from the breakout level
Like the ascending triangle, the descending pattern can occasionally break in the unexpected direction. A close above the falling upper trendline should be treated as failure.
Practical Tips for All Triangle Patterns
Time the entry carefully. Entering too early, before the breakout candle closes, means you’re guessing the direction. Wait for confirmation.
Volume matters. A breakout accompanied by a volume spike that is at least 1.5x the average of the preceding sessions carries significantly more weight than a low-volume poke through the line.
Measure the target before you enter. Calculate the maximum vertical width of the triangle before placing the trade. Know your profit target and your risk-reward ratio before committing capital.
Combine with trend direction. Triangle patterns work best when they are continuing an established trend rather than reversing one. A symmetric triangle that forms after a strong uptrend is more reliable as a continuation than one that appears at a major resistance level after a prolonged advance.
Be aware of time decay. Triangles that push past about two-thirds of their length toward the apex without breaking out tend to produce weaker, less reliable breakouts. The best moves typically occur when price breaks out somewhere in the first two-thirds of the pattern’s duration.
Connecting Triangle Patterns to Broader Analysis
Triangle patterns don’t exist in isolation. Their reliability increases when they form at key price levels identified in your support and resistance analysis, or when they align with trendlines and channels from higher time frames.
A symmetric triangle forming at a major weekly support level after an uptrend, with a breakout to the upside, represents a much higher-probability setup than the same pattern appearing in the middle of a ranging market with no clear structural context.
Key Takeaways
- Symmetric triangles are neutral; ascending and descending triangles have directional bias.
- Wait for a candlestick close beyond the trendline before entering, not just a wick through it.
- Measure the profit target using the widest vertical height of the triangle.
- Volume should expand on the breakout to confirm the move.
- Best results come when the triangle continues a clear prior trend, not when it appears at a reversal point.
- Breakouts in the first two-thirds of the triangle’s length toward the apex are generally stronger.
Continue this module: Trading Trendlines and Channels | Rectangles

Ready to Practice This Strategy?
Test what you learned on a free, risk-free demo account before risking real money.