Gap ratio
The gap ratio is an asset-liability management (ALM) metric that divides rate-sensitive assets by rate-sensitive liabilities over a defined repricing bucket to quantify interest rate risk.
The gap ratio is a fundamental interest rate risk metric utilized by bank treasurers, regulatory supervisors, and Asset-Liability Committees (ALCO) to measure a depository institution’s sensitivity to fluctuations in the yield curve. Calculated by dividing Rate-Sensitive Assets (RSA) by Rate-Sensitive Liabilities (RSL) across a defined time horizon (such as 30, 90, or 365 days), the ratio reveals whether an institution’s Net Interest Income (NII) will expand or contract when benchmark central bank policy rates change. Together with the absolute dollar gap ($\text{RSA} - \text{RSL}$) and duration gap analysis, the gap ratio serves as a frontline diagnostic tool for balance sheet liquidity and solvency management.
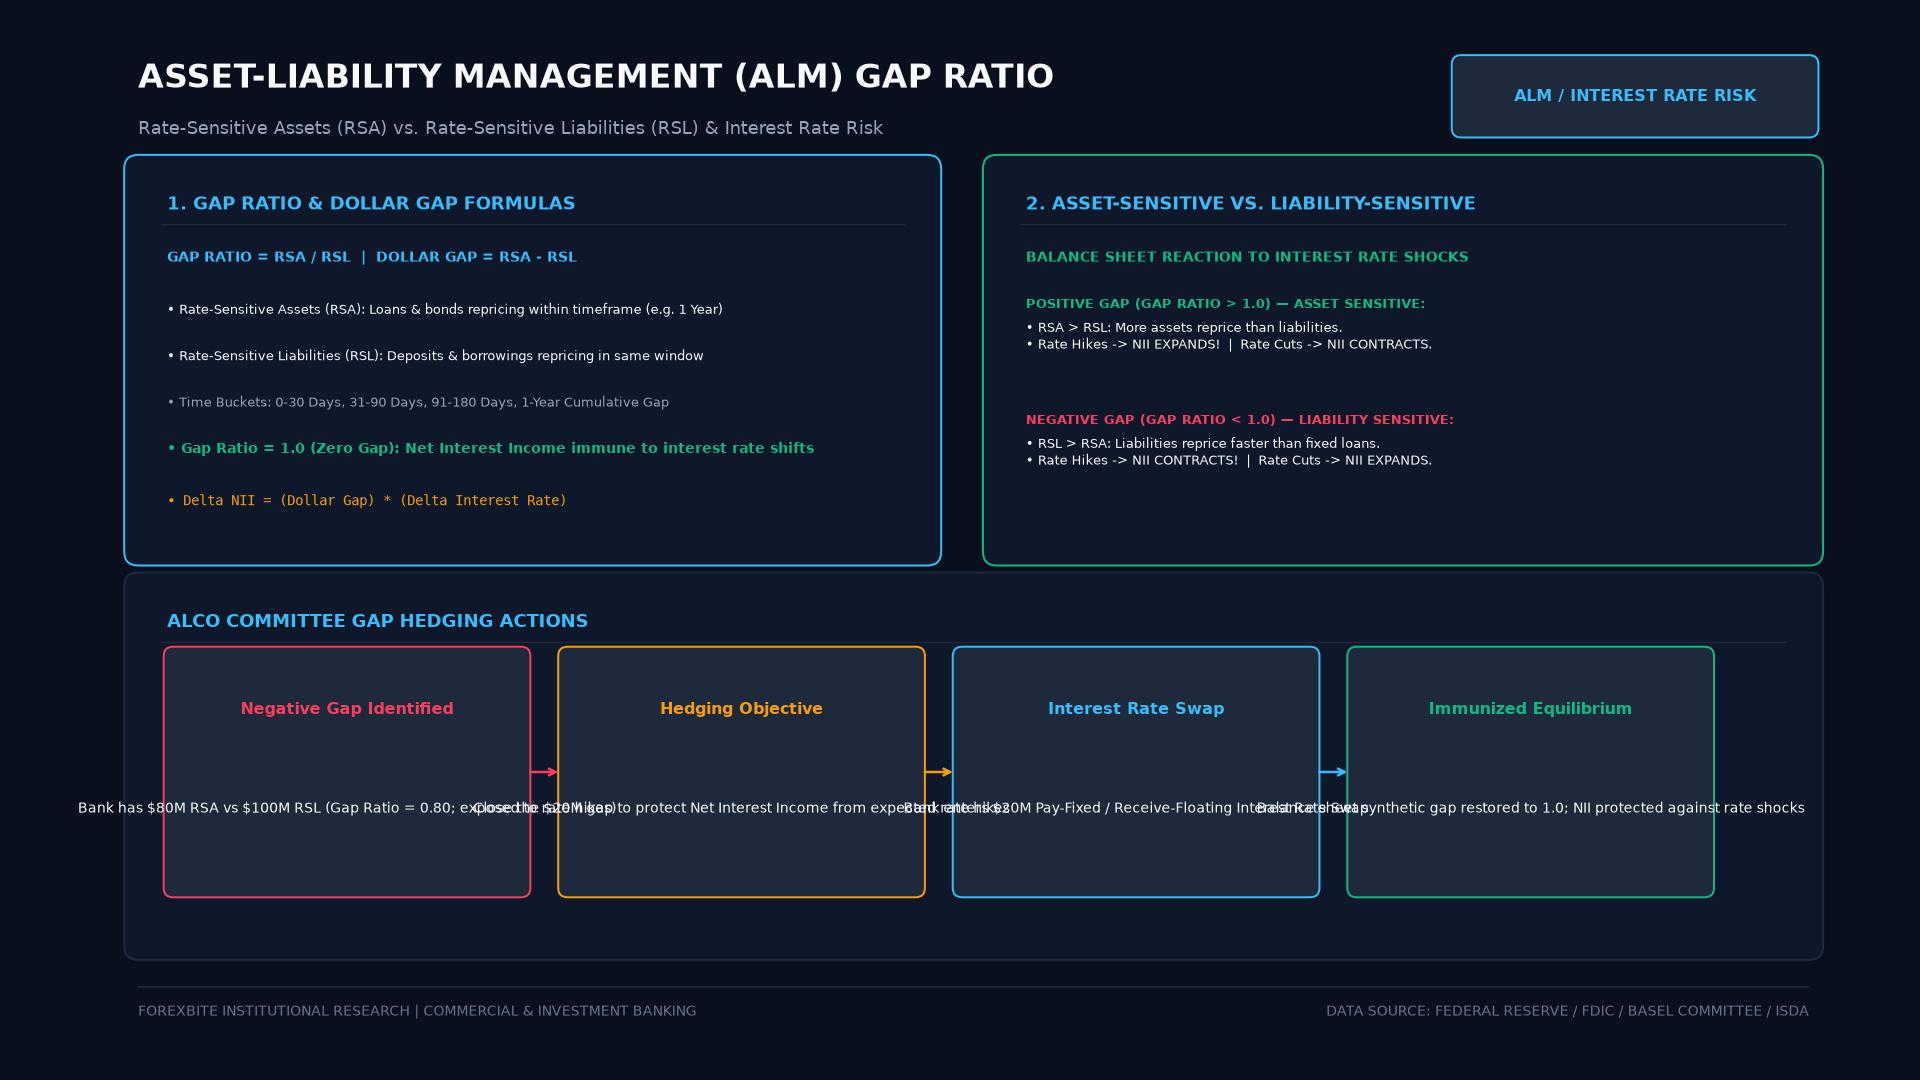 Figure: Bank interest rate risk management: Rate-Sensitive Assets (RSA) versus Rate-Sensitive Liabilities (RSL), Net Interest Margin sensitivity, and duration hedging.
Mathematical Formulations: Gap Ratio and Net Interest Income
In bank accounting, an asset or liability is classified as “rate-sensitive” within a given time bucket if its cash flows or interest rate will be contractually reset, re-indexed, or mature during that interval.
The standard gap ratio is expressed as:
$$\text{Gap Ratio} = \frac{\text{Rate-Sensitive Assets (RSA)}}{\text{Rate-Sensitive Liabilities (RSL)}}$$
Bank risk officers also calculate the Dollar Gap (or Cumulative Gap) and the Relative Gap Ratio:
$$\text{Dollar Gap} = \text{RSA} - \text{RSL}$$
$$\text{Relative Gap Ratio} = \frac{\text{RSA} - \text{RSL}}{\text{Total Assets}}$$
The direct transmission of interest rate movements to a bank’s Net Interest Income is governed by the gap relationship:
$$\Delta \text{NII} = (\text{RSA} - \text{RSL}) \times \Delta r = \text{Dollar Gap} \times \Delta r$$
Where $\Delta r$ represents the parallel shift in the benchmark interest rate.
Interpretive Scenarios: Asset Sensitivity vs Liability Sensitivity
The gap ratio categorizes a financial institution’s structural exposure into three operational states:
1. Asset-Sensitive Balance Sheet ($\text{Gap Ratio} > 1.0$)
When a bank’s rate-sensitive assets exceed its rate-sensitive liabilities, the dollar gap is positive.
- Rising Interest Rate Environment: When the central bank hikes policy rates, the yields earned on loans and floating securities adjust upward more rapidly than the cost of funding customer deposits. Consequently, the bank’s Net Interest Margin (NIM) and Net Interest Income expand.
- Falling Interest Rate Environment: When benchmark rates drop, the yields on assets fall immediately, while funding costs may hit a zero-floor or lag behind, causing NIM compression and declining profitability.
2. Liability-Sensitive Balance Sheet ($\text{Gap Ratio} < 1.0$)
When rate-sensitive liabilities exceed rate-sensitive assets, the dollar gap is negative.
- Rising Interest Rate Environment: The bank must immediately pay higher deposit rates and wholesale borrowing costs to prevent capital flight, while its long-term fixed-rate loans (such as 30-year mortgages) generate stagnant yields. Net Interest Income collapses.
- Falling Interest Rate Environment: Lower funding costs materialize quickly as liabilities reprice downward, while long-duration asset yields remain elevated, widening net interest margins.
3. Zero Gap / Matched Book ($\text{Gap Ratio} = 1.0$)
A bank maintains an equal volume of assets and liabilities repricing in each time bucket. In theory, Net Interest Income remains insulated from parallel shifts in the yield curve, although the institution remains exposed to basis risk (imperfect correlation between different rate indices).
| Gap Ratio Value | Dollar Gap Sign | Balance Sheet Profile | Impact of Rising Rates | Impact of Falling Rates |
|---|---|---|---|---|
| $> 1.0$ | Positive ($+$) | Asset-Sensitive | Net Interest Margin Expands | Net Interest Margin Compresses |
| $= 1.0$ | Zero ($0$) | Perfectly Matched Book | Net Interest Margin Neutral | Net Interest Margin Neutral |
| $< 1.0$ | Negative ($-$) | Liability-Sensitive | Net Interest Margin Compresses | Net Interest Margin Expands |
Practical Repricing Buckets in Bank Treasury Management
A single aggregate gap ratio across all maturities is insufficient for managing modern banking balance sheets. Treasury teams construct stratified “repricing ladders,” segmenting assets and liabilities into sequential maturity intervals:
- 0 to 30 Days (Ultra-Short): Fed funds sold, overnight repo, floating-rate corporate credit lines vs short-term wholesale certificates of deposit and commercial brokered deposits.
- 31 to 90 Days: Treasury bills, 3-month commercial paper vs maturing retail CDs.
- 91 to 365 Days: 1-year adjustable-rate mortgages (ARMs), short-term municipal bonds vs promotional retail term deposits.
- Over 1 Year (Non-Rate Sensitive in Short Run): 30-year fixed-rate residential mortgages, corporate term loans vs sticky core retail checking accounts and equity capital.
Analyzing incremental gap ratios across each bucket enables ALCO to identify localized maturity mismatches that an overall balance sheet ratio would conceal.
Limitations of Static Gap Analysis and Modern ALM Extensions
While the gap ratio provides an intuitive preliminary assessment, it suffers from several mechanical limitations in sophisticated financial environments:
1. The Deposit Beta Enigma
Static gap models assume that deposit costs move in lockstep with policy rates. In reality, retail deposit interest rates exhibit a non-linear relationship known as “deposit beta”:
$$\text{Deposit Beta} = \frac{\Delta \text{Bank Deposit Rate}}{\Delta \text{Central Bank Policy Rate}}$$
Core consumer checking accounts frequently carry a low beta (e.g., 0.15 to 0.30), meaning a 100-basis-point central bank hike only increases deposit costs by 15 to 30 basis points. Conversely, commercial treasury deposits and uninsured balances exhibit betas close to 1.0.
2. Embedded Options and Behavioral Runoff
Standard gap calculations struggle to capture customer optionality:
- Prepayment Risk: When interest rates drop, homeowners refinance fixed mortgages early, causing high-yielding assets to run off the balance sheet when the bank least wants them to.
- Cap and Floor Caps: Floating-rate commercial loans often contain contractual interest rate caps that prevent asset yields from rising beyond a designated ceiling during aggressive tightening cycles.
3. Duration Gap and Economic Value of Equity (EVE)
While the gap ratio focuses solely on short-term accounting income (NII), it ignores changes in the underlying market value of equity. Modern banks pair gap ratios with duration gap modeling:
$$\text{Duration Gap} = D_A - \left(\frac{L}{A}\right) D_L$$
If a bank holds long-duration fixed assets and short-duration liabilities, a sharp rise in rates destroys the market value of its assets far more than its liabilities, eroding economic equity even if current accounting NII appears stable.
Hedging the Gap: ALCO Treasury Strategies
When an Asset-Liability Committee determines that its gap ratio deviates excessively from target risk parameters, the treasury desk deploys balance sheet and off-balance-sheet hedges:
- Interest Rate Swaps: A liability-sensitive bank ($\text{Gap} < 1.0$) can enter a pay-fixed, receive-floating interest rate swap. The floating payments received from the swap offset rising deposit expenses as rates climb.
- Interest Rate Caps and Swaptions: Purchasing interest rate caps establishes an absolute ceiling on funding liabilities during inflationary spikes.
- Altering Loan Origination Mix: Shifting retail lending incentives toward adjustable-rate mortgages (ARMs) or short-term variable business lines increases Rate-Sensitive Assets, pushing the gap ratio upward toward 1.0.
Frequently Asked Questions
What happens to a bank with a gap ratio below 1.0 when the central bank raises interest rates?
A bank with a gap ratio below 1.0 is liability-sensitive. When the central bank hikes interest rates, the bank must immediately pay higher interest on its deposits and short-term borrowings to prevent depositors from moving funds to higher-yielding alternatives. However, its assets consist primarily of long-term fixed-rate loans that cannot be repriced quickly. As interest expenses rise faster than interest revenues, the bank’s Net Interest Margin collapses.
Why is the 1-year cumulative gap the most commonly monitored metric by regulators?
Regulators such as the Federal Reserve, the OCC, and the FDIC focus on the 1-year cumulative gap because it aligns with standard annual corporate budget cycles, audited financial reporting horizons, and the timeframe within which monetary policy rate adjustments transmit across the broader real economy.
How does the gap ratio differ from the credit-deposit ratio (CD ratio)?
The gap ratio measures interest rate repricing risk by comparing rate-sensitive assets to rate-sensitive liabilities within a specific time bucket. The Credit-Deposit Ratio (or Loan-to-Deposit Ratio, LDR) measures liquidity and credit risk by comparing total outstanding customer loans directly to total customer deposits, regardless of interest rate sensitivity.
Ready to trade forex?
Open a free demo account with a regulated broker. Practice with virtual funds before risking real money.