Yield Curve
A yield curve is a financial chart that plots the yields of sovereign bonds of equal credit quality across varying maturity dates, illustrating the relationship between borrowing costs, inflation expectations, and economic growth.
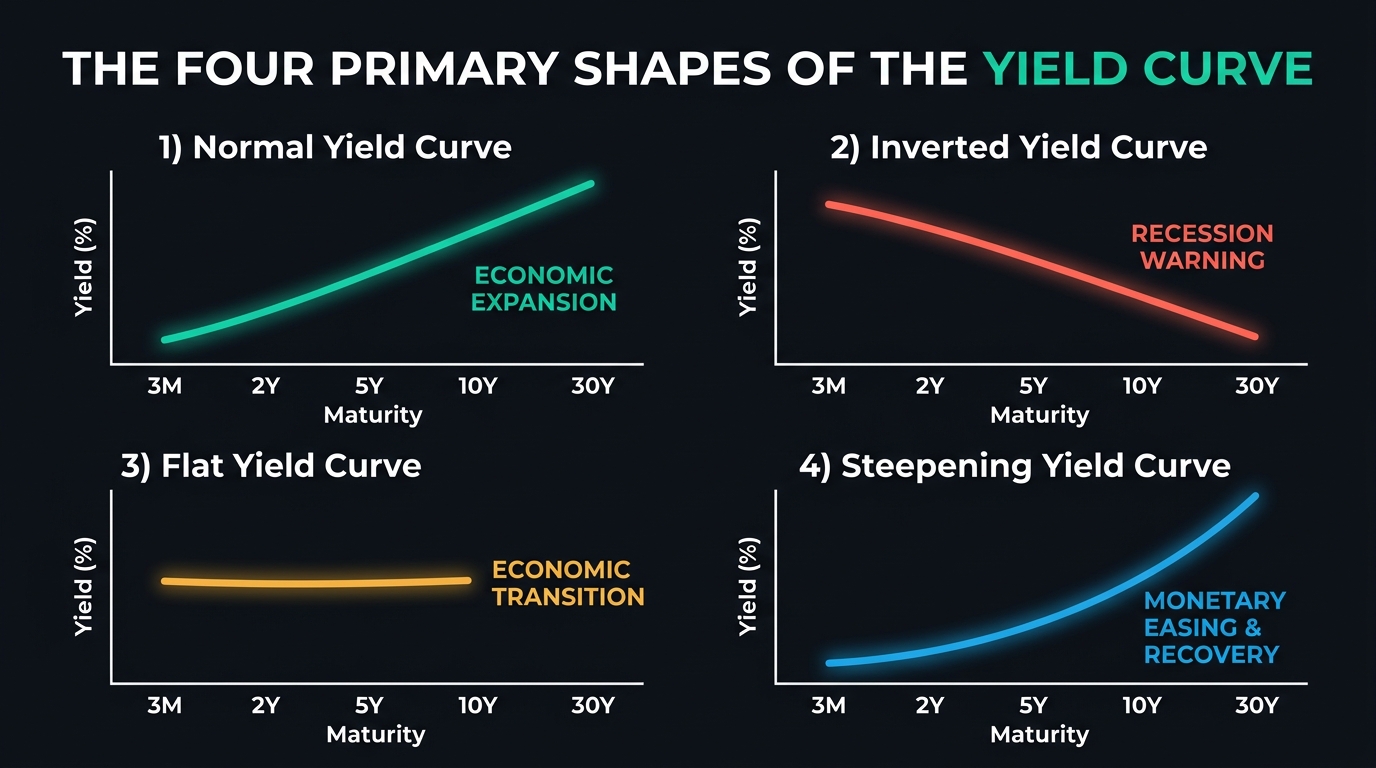
The yield curve is one of the most closely observed macroeconomic charts in global finance. By plotting the annual interest rates paid on sovereign government debt (most famously U.S. Treasury securities) across maturities ranging from 1-month treasury bills to 30-year treasury bonds, the yield curve displays the bond market’s collective expectation for future economic health, inflation, and central bank policy.
In foreign exchange trading, the yield curve serves as both a premier leading indicator of global recessions and the primary engine driving international capital flows. Shifting yield differentials between nations determine the relative attractiveness of currencies, directly powering multi-month exchange rate trends.
The Four Primary Shapes of the Yield Curve
The slope and contour of a sovereign yield curve communicate distinct economic regimes:
| Yield Curve Shape | Contour | Underlying Economic Meaning | Historical Context |
|---|---|---|---|
| Normal (Upward Sloping) | Short rates low; long rates significantly higher | Healthy economic growth; positive inflation expectations; investors demand a maturity premium for locking capital away long-term. | Standard economic expansion phases |
| Inverted (Downward Sloping) | Short rates exceed long rates | Central bank has hiked rates aggressively to combat inflation; bond markets expect an imminent recession and future rate cuts. | Reliable leading predictor of economic recessions |
| Flat | Minimal difference between short and long maturities | Economic transition or policy uncertainty; signals that the economic cycle is pivoting from expansion to slowdown. | Intermediate stage between normal and inverted |
| Steepening | Spread between 2-year and 10-year yields widens rapidly | Can occur as “Bull Steepening” (central bank slashing short rates in a crisis) or “Bear Steepening” (surging long-term inflation and fiscal deficit fears). | Early recession recovery or fiscal stimulus surge |
The Mechanics of Yield Curve Inversion
An inverted yield curve is widely regarded by economists as the single most reliable predictor of an economic downturn. When the yield on the 10-Year U.S. Treasury Note falls below the yield on the 2-Year Treasury Note (a negative 10Y–2Y spread), or when 10-year yields fall below 3-month bills, market mechanics reveal deep institutional anxiety:
$$\text{Yield Curve Spread} = \text{Yield}{10\text{Y}} - \text{Yield}{2\text{Y}}$$
- When the spread drops below $0.00%$, the curve is inverted.
- Over the past seven decades, every single U.S. recession since 1955 has been preceded by a yield curve inversion, typically with a lead time of 6 to 18 months.
- The inversion occurs because institutional asset managers, anticipating future economic distress and aggressive central bank interest rate cuts, aggressively buy long-term bonds to lock in yields, driving long-term bond prices up and their yields down.
Yield Curves and Foreign Exchange Dynamics
Exchange rates are fundamentally determined by the relative return on capital across borders. Currency traders do not analyze yield curves in isolation; they compare the yield curve of one sovereign nation against another to identify widening or narrowing yield differentials:
$$\text{Bond Yield Differential} = \text{Yield}{\text{Nation A}} - \text{Yield}{\text{Nation B}}$$
When a country’s bond yields rise relative to its peers across the curve, international institutional capital rushes into that nation’s fixed-income assets to capture the higher return. To buy those bonds, investors must purchase the domestic currency, driving its exchange rate higher.
Practical Example: The U.S.–Japan Yield Spread Driving USD/JPY
The relationship between sovereign yield spreads and currency prices is most pronounced in the USD/JPY currency pair:
- The Policy Divergence: Between 2021 and 2023, the U.S. Federal Reserve tightened policy aggressively, lifting the U.S. 10-year Treasury yield from 1.50% to over 4.80%. Meanwhile, the Bank of Japan (BoJ) enforced Yield Curve Control (YCC), capping Japan’s 10-year government bond (JGB) yield near 0.00% to 0.50%.
- The Spread Widens: The 10-year bond yield differential between the United States and Japan blew out from 140 basis points (1.40%) to more than 400 basis points (4.00%).
- Institutional Capital Rotation: Japanese institutional funds, life insurers, and global hedge funds borrowed yen cheaply and deployed trillions into high-yielding U.S. Treasuries (the classic bond-market carry trade).
- Market Outcome: As the yield differential surged, USD/JPY rallied in lockstep from 110.00 to above 151.90. The correlation between the U.S.–Japan 10-year yield spread and the USD/JPY spot exchange rate exceeded 0.90, demonstrating that bond yields were the true master driver of the currency’s trend.
Key Takeaways
- Term Structure of Interest Rates: The yield curve illustrates the interest rates paid on sovereign bonds across maturities from short-term bills to long-term bonds.
- Economic Harbinger: A normal curve reflects economic health, while an inverted curve has reliably preceded every modern U.S. economic recession.
- Yield Differentials Rule Forex: Relative spreads between sovereign yield curves dictate international capital flows and anchor major exchange rate trends.
- USD/JPY Barometer: USD/JPY displays an exceptionally tight statistical correlation with U.S. Treasury yields and the U.S.–Japan sovereign yield spread.
- Curve Dynamics: Traders monitor curve steepeners and flatteners to anticipate turning points in central bank monetary policy cycles.
Frequently Asked Questions
Which yield curve spread is the most reliable recession predictor?
Institutional economists closely watch two primary spreads: the 10-year minus 2-year Treasury spread (popular among financial media and bond traders) and the 10-year minus 3-month Treasury spread (favored by academic researchers and the Federal Reserve). Both have exceptional track records in predicting economic downturns.
Why does a yield curve flatten?
A yield curve flattens when short-term interest rates rise faster than long-term rates (often because the central bank is hiking rates to fight inflation), or when long-term interest rates fall faster than short-term rates due to declining long-term economic growth expectations.
Does an inverted yield curve cause a recession?
An inverted yield curve does not technically cause a recession by itself; it is a reflection of bond market expectations and credit conditions. However, an inverted curve strains commercial banking models—banks borrow short-term to lend long-term, and when the curve inverts, profit margins vanish, causing banks to restrict credit lending to the real economy.
Ready to trade forex?
Open a free demo account with a regulated broker. Practice with virtual funds before risking real money.