Line Chart
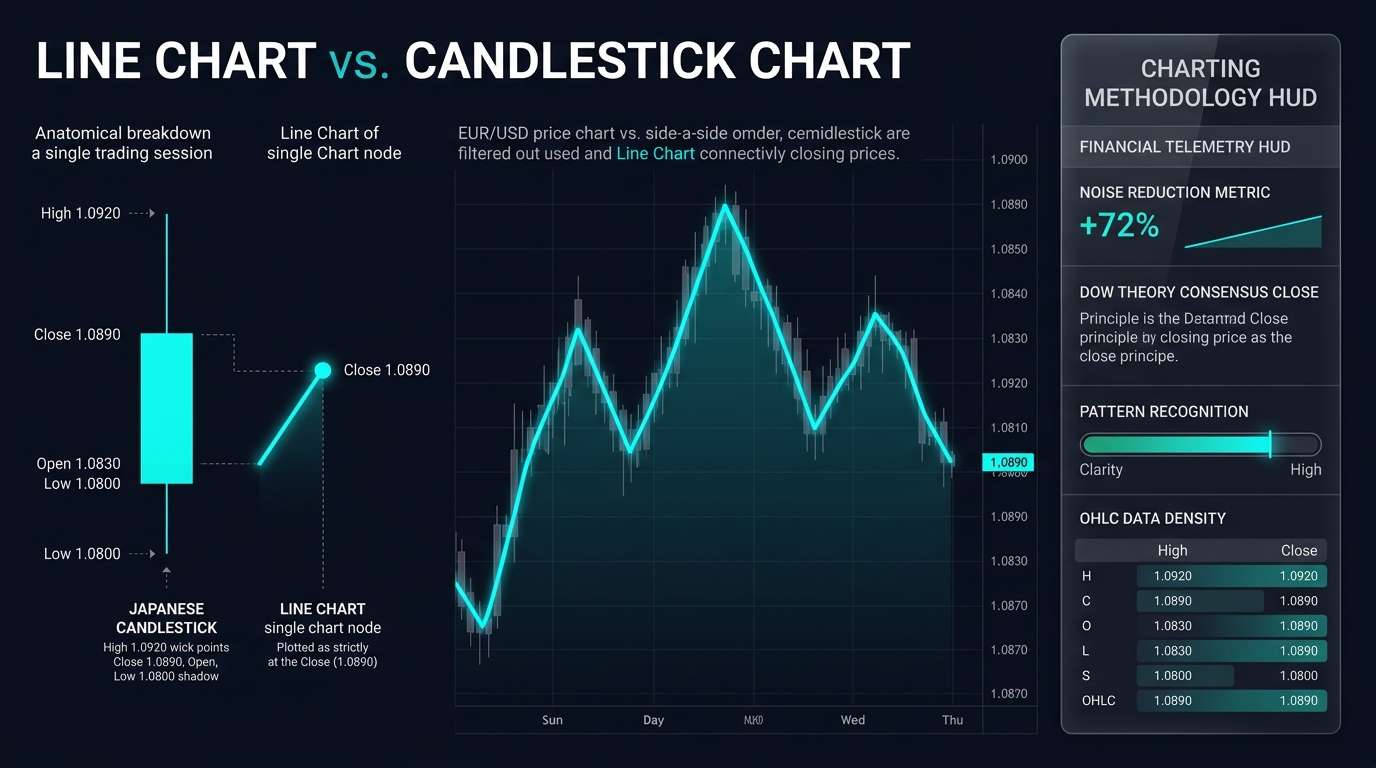
A line chart is a foundational graphical representation of price action created by connecting a chronological series of single data points—almost exclusively closing prices—with a continuous line segment, filtering out intra-period volatility to emphasize primary market trends.
What Is a Line Chart?
A line chart is the simplest and most visually direct chart type utilized in financial and foreign exchange technical analysis. It is plotted by plotting a single price point for each sequential time period (such as 1 minute, 1 hour, 1 day, or 1 week) along a two-dimensional grid—with time on the horizontal X-axis and price on the vertical Y-axis—and connecting those consecutive points with straight lines.
While modern charting platforms offer sophisticated graphical formats like Japanese candlesticks and OHLC bars, the line chart remains a fundamental analytical tool. In technical analysis, the line chart almost universally plots the closing price ($P_{\text{close}}$) of each period. By omitting intraday highs, lows, and opening levels, the line chart strips away market noise, false breakout wicks, and erratic intraday whipsaws, presenting an unobstructed visualization of underlying trend direction and structural market momentum.
Key Takeaways
- Focus on the Close: Founded on the principles of Dow Theory, line charts treat the closing price as the most significant metric of the session, representing the definitive consensus of value when all speculative dust settles.
- Noise Reduction: Line charts eliminate visual clutter and exaggerated price wicks caused by illiquid stop-hunts or transient economic news spikes, making macro trends immediately obvious.
- Pattern Clarity: Classical geometric chart patterns—such as Head and Shoulders, Double Tops/Bottoms, and Symmetrical Triangles—are often far easier to identify objectively on line charts than on noisy candlestick displays.
- Basis for Technical Indicators: Most traditional momentum oscillators and trend indicators (including the Relative Strength Index [RSI], Moving Averages [SMA/EMA], and MACD) are mathematically calculated using closing prices, making line charts the direct visual counterpart to indicator signals.
- Lack of Volatility Context: The primary weakness of a line chart is its complete omission of range information: it cannot reveal whether a session closed calmly or experienced a 300-pip panic before recovering.
Comparative Taxonomy: Financial Chart Types
| Chart Type | Data Points Plotted | Volatility Transparency | Trend Identification Speed | Primary Analytical Strength |
|---|---|---|---|---|
| Line Chart | 1 (Close only) | Low (Hides intraday range) | Instantaneous (Maximum simplicity) | Macro trend identification, Dow Theory confirmation, intermarket comparisons |
| Candlestick | 4 (Open, High, Low, Close) | Maximum (Full range & body) | Moderate (Requires reading patterns) | Price action triggers, pin bars, engulfing patterns, rejection wicks |
| OHLC Bar | 4 (Open, High, Low, Close) | High (Tick marks on vertical line) | Moderate | Traditional Western technical analysis, volatility distribution |
| Renko Chart | Price movement only | Filters time entirely | High | Trend continuation, eliminates sideways consolidation |
Dow Theory and the Preeminence of Closing Prices
The analytical rationale behind prioritizing line charts dates back to Charles H. Dow, founder of The Wall Street Journal and creator of the Dow Jones Industrial Average. Dow posited that:
- Intraday fluctuations are largely random: Highs and lows during active market hours are frequently driven by emotional retail flow, speculative stop-running, and temporary liquidity voids.
- Closing prices represent institutional settlement: The closing price represents the final, calculated balance of power between commercial banks, corporate hedgers, and institutional asset managers who hold overnight balance sheet risk.
When a technical analyst switches a daily forex chart to a line chart, they are analyzing the market strictly through the lens of institutional settlement rather than intraday noise.
Practical Application: Identifying Closing Breakouts vs. Wick Traps
Consider an active currency trader analyzing major resistance on EUR/USD at 1.0900.
- The Candlestick Trap: On a daily candlestick chart, the trader observes price spiking up to 1.0935 on Friday afternoon following a hot U.S. economic print. Traders relying on candlestick highs declare a bullish breakout and enter aggressive long positions. However, by 5:00 PM New York close, price retreats, closing at 1.0888, leaving behind a long upper wick.
- The Line Chart Confirmation: The trader switches to a Line Chart (Close).
- The line chart reveals that the closing price never crossed 1.0900; the line peaked cleanly at 1.0888 and sloped downward.
- The breakout was an intraday illusion (a “fakeout” or liquidity grab).
- Execution Edge: By requiring a closing line break above 1.0900 before validating structural support/resistance breaches, the trader avoids being trapped on false breakouts and preserves capital.
Limitations and Pitfalls of Line Charts
- Blindness to Gap Risk: A line chart visually masks weekend price gaps and session opening dislocations, drawing a smooth connecting slope between two disparate price levels and hiding severe slippage events.
- Inability to Assess Rejection: Line charts obscure whether buyers pushed aggressively off a daily low (a bullish pin bar) or whether sellers dominated the session before an eleventh-hour reversal.
- Unsuitable for High-Frequency Scalping: Day traders and scalpers who depend on order-flow imbalances, bid-ask spreads, and candlestick wick behavior cannot extract actionable execution timing from a pure closing line.
Frequently Asked Questions (FAQ)
Can a line chart be plotted using prices other than the close?
Yes. Modern charting software (such as TradingView or MetaTrader) allows traders to construct line charts based on Open, High, Low, Median Price $((H+L)/2)$, or Typical Price $((H+L+C)/3)$. However, the standard closing-price line chart remains the universal default across global finance.
Why do institutional macro analysts prefer line charts for multi-asset overlays?
When comparing multiple assets on a single screen—such as overlaying the U.S. Dollar Index (DXY) against 10-Year U.S. Treasury Yields and Brent Crude Oil—using candlesticks creates an unreadable, chaotic mess. Line charts normalized to percentage performance enable clean, clear comparative correlation analysis.
Are chart patterns like “Head and Shoulders” valid on a line chart?
Yes, and many professional technicians argue they are more reliable on line charts. Because line charts connect only closing values, neckline breaks on a line chart represent true closing-basis confirmation rather than temporary intraday penetrations that fail by the session close.
Ready to trade forex?
Open a free demo account with a regulated broker. Practice with virtual funds before risking real money.