Candlestick Chart
A candlestick chart displays four key price points for each time period — open, high, low, and close — using a visual 'candle' body and wicks. Developed in 18th-century Japan by rice traders, it remains the dominant chart type in modern forex and stock markets.
Reading the Language of Candlestick Charts
Before technical indicators, before MACD and RSI, traders had candlesticks. Japanese rice merchant Munehisa Homma developed candlestick charting in the 1700s to track rice prices at the Dojima Rice Exchange in Osaka. His methods, refined over centuries, now appear on every trading platform in the world because they encode four critical pieces of information into a single visual unit.
Each candle represents a specific time period — one minute, one hour, one day, whatever timeframe you’re viewing. Within that period, price moves from an opening level to a closing level, reaching a high and a low along the way. The candlestick captures all four data points simultaneously.
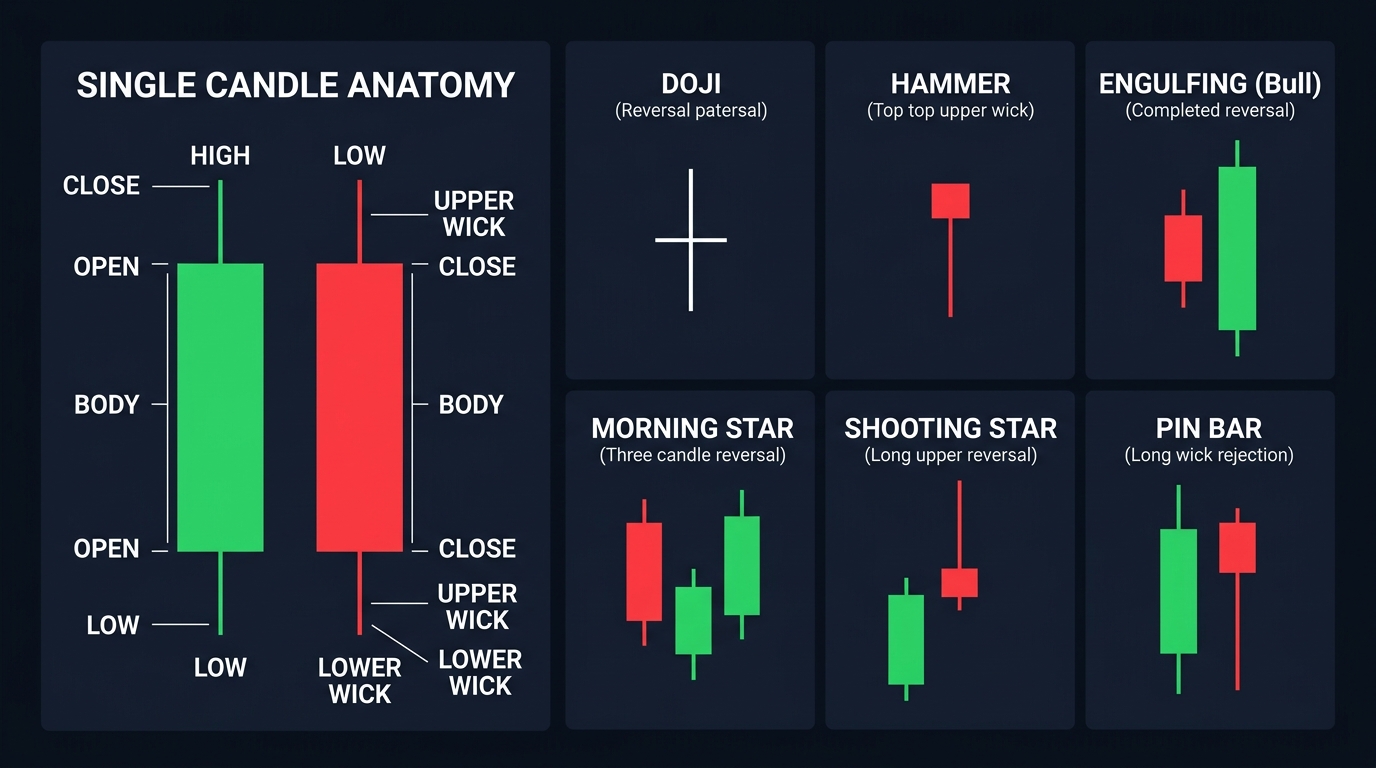
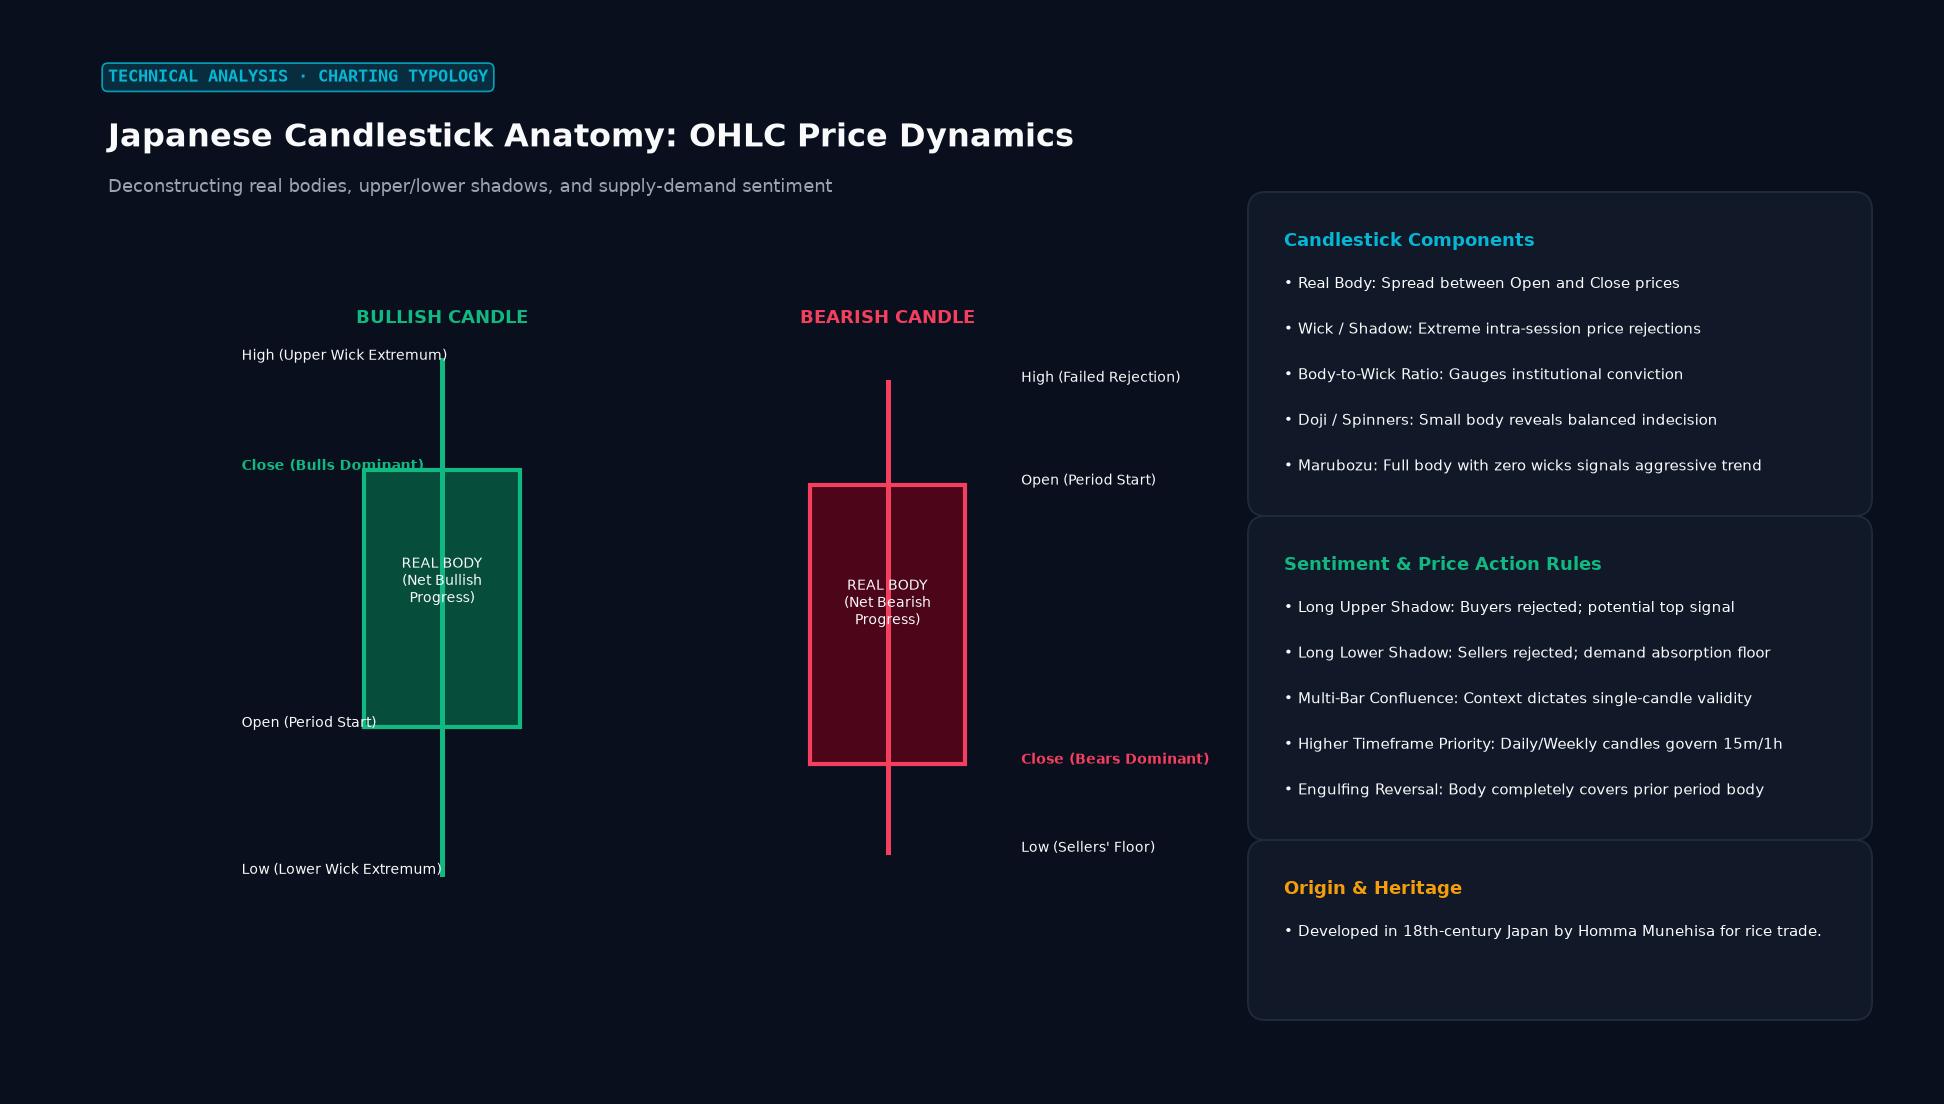 Figure: Deconstructing real bodies, upper/lower shadows, and supply-demand sentiment
Anatomy of a Single Candle
The main rectangular body of the candle shows the range between the open and close prices. The thin lines extending above and below the body are called wicks (or shadows) — they show the high and low extremes reached during the period.
Bullish candle (green or white): Close is higher than open. Price moved up during the period. The body runs from open (bottom) to close (top).
Bearish candle (red or black): Close is lower than open. Price fell during the period. The body runs from close (bottom) to open (top).
The relative size of body vs. wicks tells a story. A candle with a large body and tiny wicks shows decisive directional movement — buyers or sellers dominated the entire session. A candle with a small body and long wicks on both sides shows indecision — price explored both directions but ended near where it started.
High-Probability Candlestick Patterns
Candlestick patterns are the configurations formed by one, two, or three consecutive candles. Traders use them to identify potential reversals or continuations. A few patterns consistently appear across textbooks, prop desks, and institutional research:
Doji: Open and close are virtually identical, creating a cross shape. It signals indecision — neither buyers nor sellers controlled the period. A doji at the top of a rally is bearish; at the bottom of a decline, potentially bullish.
Hammer / Hanging Man: A small body at the top of a long lower wick. At a downtrend bottom, it’s a hammer (bullish reversal). The same shape at an uptrend peak is a hanging man (bearish warning). The long wick shows that sellers drove price down sharply, but buyers recovered it by close.
Engulfing Pattern: A two-candle pattern where the second candle’s body completely engulfs the first. Bullish engulfing (small bearish candle followed by a large bullish one) at support is one of the cleaner reversal signals in technical analysis. Bearish engulfing at resistance is its mirror.
Morning Star / Evening Star: Three-candle patterns marking major turning points. The morning star — a large bearish candle, then a small indecisive candle, then a large bullish candle — appears at lows and signals a reversal. The evening star does the reverse at highs.
Shooting Star / Inverted Hammer: Small body at the bottom of a long upper wick. The price shot up but was rejected by sellers and closed near the open. At resistance levels or the peak of an uptrend, this is a reliable bearish signal.
Timeframe Matters
The same candlestick pattern carries different weight depending on the timeframe. A hammer on a 1-minute chart is noise. The same pattern on a daily chart at a key support level represents a meaningful shift in market sentiment, with institutional-sized participants involved in the move.
Most serious traders use multiple timeframes: identify the trend on the daily chart, look for setups on the 4-hour, and time entries on the 1-hour. A candlestick reversal pattern that appears simultaneously on two or more timeframes is significantly more reliable than one appearing in isolation.
Candlesticks vs. Other Chart Types
Bar charts and candlestick charts convey identical information — the visual format differs. Candlesticks are widely preferred because the colored bodies make bullish vs. bearish periods instantly recognizable at a glance. Line charts, which only plot closing prices, lose the open/high/low data entirely and miss significant intra-period information.
Point and figure charts filter out time entirely — they’re useful for identifying key price levels but strip away the temporal narrative that makes candlestick analysis powerful.
Key Takeaways
- Each candle encodes open, high, low, and close for a given time period
- Green/white candles are bullish (close > open); red/black are bearish (close < open)
- Body size reflects conviction; wick length shows price rejection
- Patterns like hammer, engulfing, and doji are most reliable at key support/resistance levels
- Higher timeframe candle patterns carry more weight than lower timeframe signals
FAQ
How many candlestick patterns should I learn? Knowing 8–12 high-quality patterns well outperforms memorizing 50 patterns superficially. Focus on: doji, hammer/hanging man, engulfing, morning/evening star, shooting star, and pin bar. These appear frequently and have strong academic and practitioner backing.
Do candlestick patterns work on their own? Rarely. They’re most effective when combined with context: pattern appearing at a key support or resistance level, in confluence with a moving average or Fibonacci level, and confirmed by the next candle’s price action. Isolated patterns without context generate too many false signals.
Ready to trade forex?
Open a free demo account with a regulated broker. Practice with virtual funds before risking real money.