MIRR
The Modified Internal Rate of Return (MIRR) is a corporate finance metric that evaluates capital investment profitability by assuming positive cash flows are reinvested at the cost of capital and negative cash flows are financed at the financing rate.
The Modified Internal Rate of Return (MIRR) is an advanced capital budgeting and investment valuation metric designed to overcome the structural mathematical and practical limitations of the traditional Internal Rate of Return (IRR). While standard IRR remains widely utilized across corporate finance and private equity dealing desks, it relies on theoretical assumptions regarding cash-flow reinvestment that rarely reflect economic reality.
MIRR introduces two distinct, customizable interest rate parameters:
- The Reinvestment Rate: The rate at which interim positive cash inflows are compounded forward to the final terminal year of the project (typically the company’s Weighted Average Cost of Capital, or WACC).
- The Financing Rate: The interest rate applied to discount interim negative cash outflows back to Year 0 (typically the firm’s marginal cost of debt borrowing).
By divorcing project returns from the unrealistic assumption that interim cash is continuously reinvested at the internal project rate, MIRR delivers a conservative, realistic rate of return and guarantees a single mathematical solution for projects with non-normal cash flows.
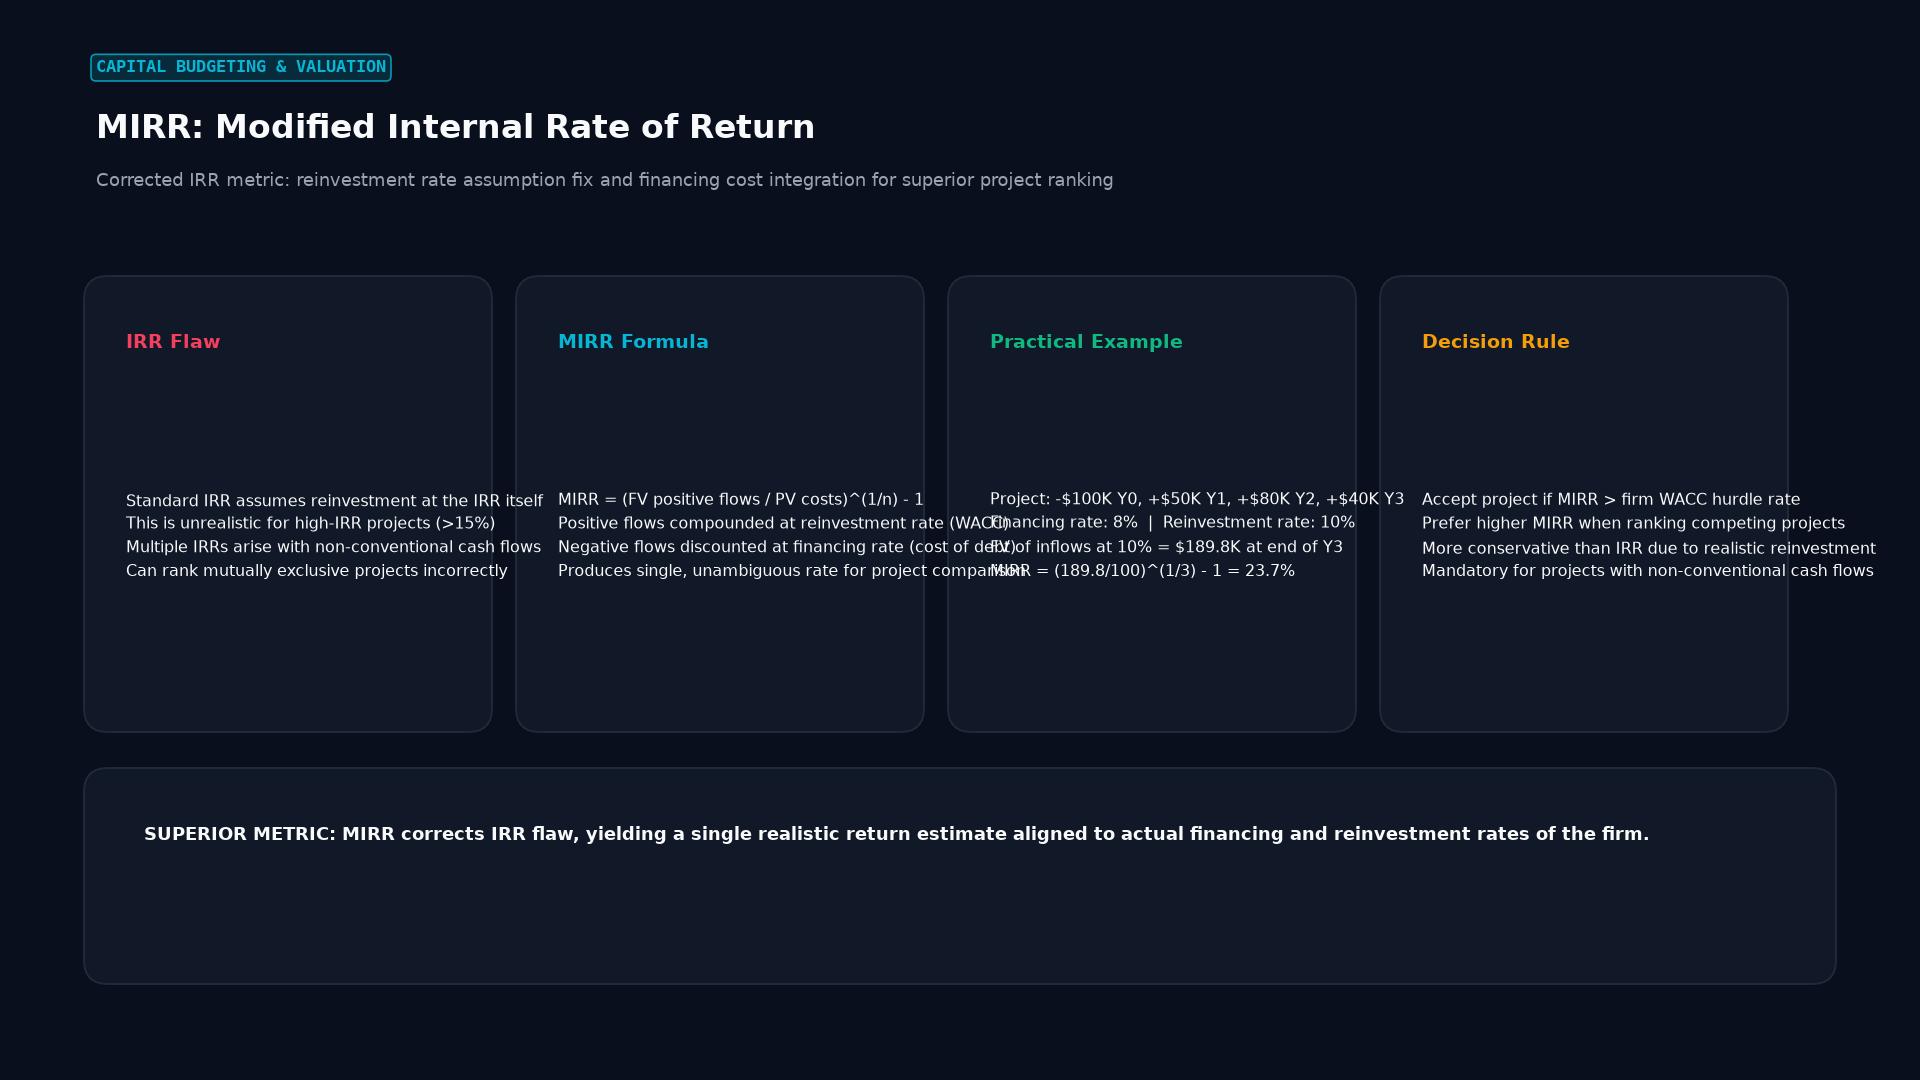 Figure: Corrected IRR metric: reinvestment rate assumption fix and financing cost integration for superior project ranking
Theoretical Flaws of the Standard Internal Rate of Return (IRR)
The classical Internal Rate of Return is mathematically defined as the discount rate ($r$) that sets the Net Present Value ($NPV$) of all project cash flows equal to exactly zero:
$$\text{NPV} = \sum_{t=0}^{n} \frac{\text{CF}_t}{(1 + \text{IRR})^t} = 0$$
Despite its widespread popularity, traditional IRR suffers from three major analytical flaws:
1. The Flawed Reinvestment Rate Assumption
Implicit within the mathematical derivation of standard IRR is the assumption that all interim positive cash flows generated by the asset can be immediately reinvested elsewhere in the business at the exact same internal rate of return.
If a private equity fund executes an exceptional growth buyout yielding an IRR of 55%, the traditional IRR formula assumes every interim dividend distributed in Year 1 and Year 2 can be redeployed into new investments also earning 55% compound returns. In mature, competitive markets, this assumption is impossible. Reinvesting interim capital at the firm’s actual cost of capital (such as a 9% or 10% WACC) is far more realistic, which is precisely the calibration enforced by MIRR.
2. The Multiple Rates of Return Problem (Non-Normal Cash Flows)
A standard investment displays a “normal” cash flow profile: an initial cash outflow at $t=0$ followed by a series of positive cash inflows ($ - , + , + , + $). However, industrial projects frequently feature non-normal cash flows where negative cash flows occur later in the project lifecycle:
- Natural resource extraction (mines and oil wells requiring massive reclamation and environmental cleanup costs at decommissioning).
- Nuclear power stations (high decommissioning liabilities).
- Infrastructure concessions (major mid-cycle scheduled asset overhauls).
Under Descartes’ Rule of Signs, a polynomial equation of degree $n$ can have as many real positive roots as there are sign changes in the sequence of cash flows. A project with two sign changes ($ - , + , + , - $) can produce two distinct, conflicting IRR percentages that both satisfy $\text{NPV} = 0$. In extreme cases, no real mathematical root exists. MIRR eliminates this problem by converting all negative cash flows into a single present-value cost at $t=0$, guaranteeing exactly one unique real rate of return.
3. Scale and Mutually Exclusive Project Bias
Traditional IRR expresses return purely as a percentage, ignoring project scale:
- Project Alpha: Invest $1,000 today, receive $2,500 next year ($\text{IRR} = 150%$; Net Profit = $1,500).
- Project Beta: Invest $10,000,000 today, receive $18,000,000 next year ($\text{IRR} = 80%$; Net Profit = $8,000,000).
An unsophisticated manager relying solely on IRR would rank Project Alpha ahead of Project Beta, destroying substantial enterprise value.
       IRR VS MIRR: CORE STRUCTURAL ASSUMPTIONS

Dimension               Standard IRR                     Modified IRR (MIRR)
----------------------------------------------------------------------------------
Reinvestment Rate       Assumed equal to project IRR     Explicitly set to WACC
Financing Rate          Assumed equal to project IRR     Explicitly set to Cost of Debt
Multiple Roots Issue    Frequent in non-normal flows     Mathematically impossible (1 root)
Reinvestment Bias       Consistently overstates returns  Conservative, realistic returns
Decision Consistency    Can conflict with NPV ranking    Aligns closely with NPV ranking
Mathematical Architecture of the MIRR Formula
The Modified Internal Rate of Return is calculated through three systematic computational stages:
Step 1: Compute the Present Value of Negative Cash Flows ($PV_{\text{outflows}}$)
Identify all negative cash flows ($\text{CF}_t < 0$) across the project timeline and discount them back to Year 0 using the financing rate ($r_f$):
$$PV_{\text{outflows}} = \sum_{t=0}^{n} \frac{\max(0, -\text{CF}_t)}{(1 + r_f)^t}$$
Step 2: Compute the Terminal Value of Positive Cash Flows ($TV_{\text{inflows}}$)
Identify all positive cash flows ($\text{CF}_t > 0$) across the project timeline and compound them forward to the terminal year $n$ using the reinvestment rate ($r_r$):
$$TV_{\text{inflows}} = \sum_{t=0}^{n} \max(0, \text{CF}_t) \times (1 + r_r)^{n - t}$$
Step 3: Solve for MIRR
Equate the present value of outflows to the terminal value of inflows discounted over $n$ periods:
$$PV_{\text{outflows}} = \frac{TV_{\text{inflows}}}{(1 + \text{MIRR})^n}$$
Solving algebraically for MIRR yields the closed-form equation:
$$\text{MIRR} = \left( \frac{TV_{\text{inflows}}}{PV_{\text{outflows}}} \right)^{\frac{1}{n}} - 1$$
       MIRR HORIZON GEOMETRY (TIMELINE MAPPING)

   t = 0                                                 t = n
+-----------------------+                      +-----------------------+
| Present Value (PV)    |                      | Terminal Value (TV)   |
| Sum of all discounted |                      | Sum of all compounded |
| negative cash flows   |                      | positive cash flows   |
| (at Financing Rate)   |                      | (at Reinvestment Rate)|
+-----------------------+                      +-----------------------+
            \                                              /
             \                                            /
              \======>   Solve Single Annual Rate   <====/
                         [(TV / PV)^(1/n)] - 1
Real-World Case Study: Infrastructure Mine with Decommissioning Liabilities
To observe how standard IRR fails and how MIRR resolves capital allocation ambiguity, consider a global mining enterprise, Apex Lithium Corp, evaluating a 5-year open-pit lithium extraction project.
Project Cash Flows
- Year 0 (Exploration and Mine Construction): -$12,000,000
- Year 1 (Commercial Extraction): +$6,000,000
- Year 2 (Commercial Extraction): +$8,000,000
- Year 3 (Commercial Extraction): +$7,000,000
- Year 4 (Tailings Processing): +$3,000,000
- Year 5 (Environmental Remediation & Decommissioning): -$6,000,000
The corporate financing rate (borrowing cost of debt) is 6.0%, and the corporate reinvestment rate (corporate WACC) is 10.0%.
The Failure of Traditional IRR
Notice the cash flow signs: $( - , + , + , + , + , - )$. There are two distinct sign changes. Plotting the Net Present Value profile generates a non-linear curve that intersects the horizontal zero axis at two separate rates:
- $\text{IRR}_1 = 11.24%$
- $\text{IRR}_2 = 33.82%$
Corporate executives cannot determine whether the true return of the mine is 11.24% or 33.82%, leaving the project approval decision in doubt.
+--------------------------------------------------------------------+
|               APEX LITHIUM CORP: MIRR RESOLUTION                   |
+--------------------------------------------------------------------+
| 1. Discount Negative Cash Flows to Present Value (PV @ 6.0%):      |
|    - Year 0 Outflow: $12,000,000                                   |
|    - Year 5 Outflow: $6,000,000 / (1 + 0.06)^5 = $4,483,546        |
|    Total PV of Outflows = $12,000,000 + $4,483,546 = $16,483,546   |
+--------------------------------------------------------------------+
| 2. Compound Positive Cash Flows to Terminal Value (TV @ 10.0%):    |
|    - Year 1 Inflow: $6,000,000 * (1.10)^4 = $8,784,600             |
|    - Year 2 Inflow: $8,000,000 * (1.10)^3 = $10,648,000            |
|    - Year 3 Inflow: $7,000,000 * (1.10)^2 = $8,470,000             |
|    - Year 4 Inflow: $3,000,000 * (1.10)^1 = $3,300,000             |
|    Total Terminal Value (TV) of Inflows = $31,202,600              |
+--------------------------------------------------------------------+
| 3. Solve for MIRR over 5-Year Horizon:                             |
|    MIRR = ($31,202,600 / $16,483,546)^(1 / 5) - 1                  |
|    MIRR = (1.89295)^(0.20) - 1                                     |
|    MIRR = 1.1361 - 1 = 13.61%                                      |
+--------------------------------------------------------------------+
| Investment Decision:                                               |
| - Traditional IRR generated two conflicting answers.               |
| - MIRR provides a single unambiguous metric: 13.61%.               |
| - Because MIRR (13.61%) exceeds the corporate hurdle rate (10.0%),|
|   the project creates shareholder value and is approved.           |
+--------------------------------------------------------------------+
Comparison: NPV vs IRR vs MIRR
Financial directors evaluate capital allocations across three primary quantitative criteria:
| Metric | Primary Advantage | Primary Limitation | Reinvestment Rate Reality |
|---|---|---|---|
| Net Present Value (NPV) | Quantifies absolute dollar value created | Does not express capital efficiency percentage | Realistic (Discounted at WACC) |
| Internal Rate of Return (IRR) | Familiar annualized percentage metric | Multiple roots; overstates returns | Unrealistic (Reinvests at IRR) |
| Modified IRR (MIRR) | Realistic percentage; eliminates multiple roots | Requires selecting explicit reinvestment rate | Highly Realistic (Reinvests at WACC) |
Implementation in Spreadsheet Software
Modern financial modeling platforms incorporate native functions to execute MIRR calculations without manual multi-stage compounding:
- Microsoft Excel / Google Sheets Syntax:
=MIRR(values, finance_rate, reinvest_rate)Where:values: The array of contiguous cells containing the periodic cash flows.finance_rate: The interest rate paid on debt used to finance negative cash flows.reinvest_rate: The corporate cost of capital or return earned on reinvested cash.
Financial analysts constructing leveraged buyout (LBO) or discounted cash flow (DCF) models routinely place the =MIRR output alongside standard =IRR to demonstrate the impact of reinvestment drag to investment committees.
Frequently Asked Questions
Why is MIRR almost always lower than traditional IRR?
For profitable projects, MIRR is virtually always lower than traditional IRR because traditional IRR assumes interim cash flows are reinvested at the project’s own high internal rate of return. MIRR assumes interim cash flows are reinvested at the company’s lower, more realistic cost of capital (WACC). As a result, MIRR dampens the exaggerated compounding effect of standard IRR, providing a more grounded estimate of future returns.
Can MIRR ever conflict with Net Present Value (NPV) rankings?
While MIRR substantially improves ranking consistency compared to traditional IRR, conflicts between NPV and MIRR can occasionally emerge when comparing mutually exclusive projects of dramatically differing initial scale. Because MIRR is a percentage efficiency metric, a small project requiring $10,000 with a 30% MIRR may rank above a $50,000,000 project with a 20% MIRR, even though the larger project creates far more aggregate dollar wealth for shareholders. For mutually exclusive capital decisions, NPV remains the ultimate decision benchmark.
What should be used as the reinvestment rate in an MIRR calculation?
In standard corporate finance practice, the reinvestment rate is set to the enterprise’s Weighted Average Cost of Capital (WACC), as this represents the expected hurdle rate for marginal capital deployment across the firm. In private equity or asset management, fund managers may use the benchmark return of the broader market index (e.g., 8% for the S&P 500) or the contractual preferred return hurdle (e.g., 8% to 10%) to reflect realistic reinvestment opportunities for LP distributions.
Ready to trade forex?
Open a free demo account with a regulated broker. Practice with virtual funds before risking real money.