Parabolic Stop and Reverse (SAR)
The Parabolic Stop and Reverse (SAR) is a technical indicator developed by J. Welles Wilder Jr. that places a trailing price envelope above or below market action, identifying trend direction and signaling potential exit or reversal points.
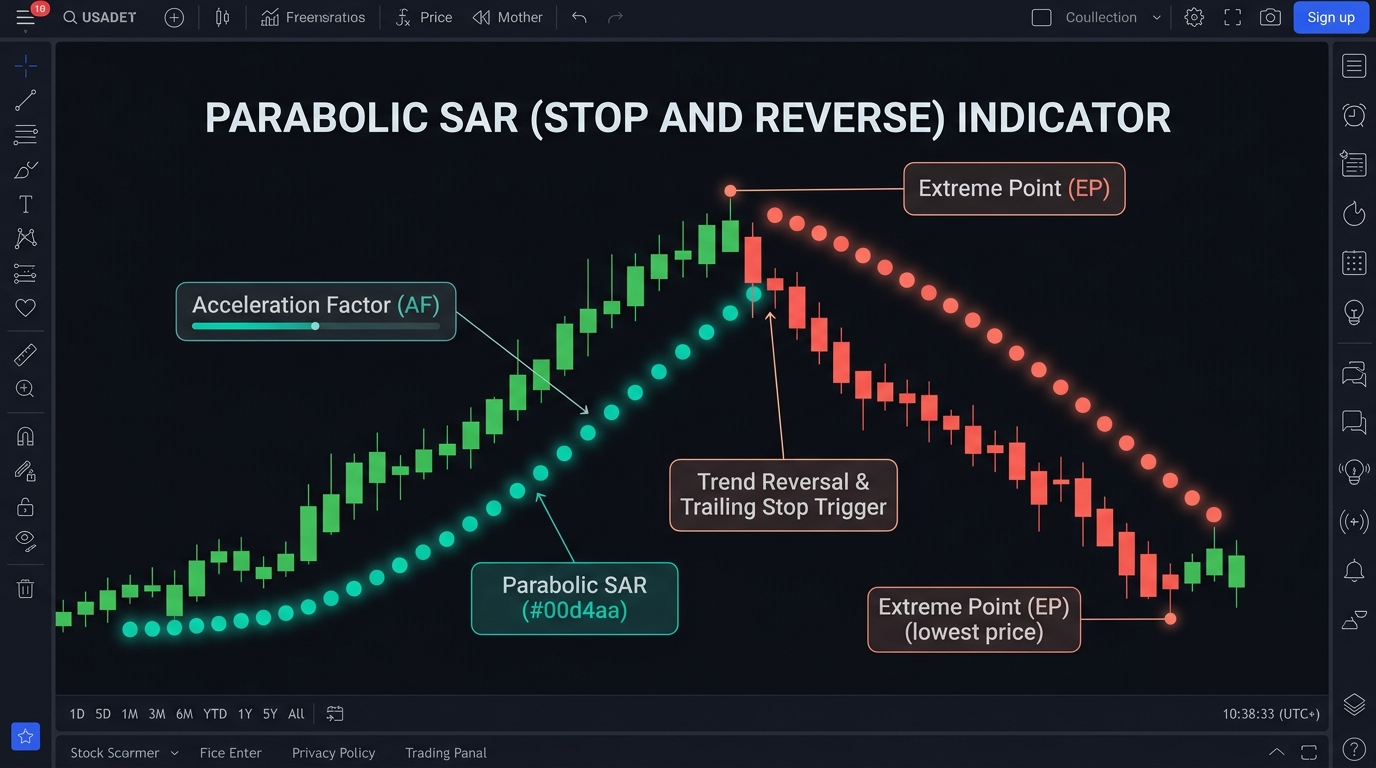
Introduced in 1978 by legendary technical analyst J. Welles Wilder Jr. in his seminal book New Concepts in Technical Trading Systems, the Parabolic Stop and Reverse (SAR) is a time-and-price-based trend-following indicator. Plotted on currency charts as a series of dots, the Parabolic SAR is designed to solve one of the greatest challenges in trading: systematically trailing a stop-loss to protect accumulated profits without cutting a winning trend short.
The indicator is rooted in the concept of time decay in momentum. If a market breaks out into a trend but fails to generate continued directional progress, the Parabolic SAR’s mathematical formula accelerates toward current price action, eventually forcing an exit before gains evaporate.
Mathematical Formula and the Acceleration Factor
The calculation of the Parabolic SAR relies on two critical components: the Extreme Point (EP) and the Acceleration Factor ($\alpha$ or AF).
$$\text{SAR}{\text{tomorrow}} = \text{SAR}{\text{today}} + \alpha \times \big(\text{EP} - \text{SAR}_{\text{today}}\big)$$
Where:
- $\text{SAR}_{\text{today}}$: The calculated stop level for the current period.
- $\text{EP}$ (Extreme Point): The highest high reached during the current uptrend, or the lowest low recorded during the current downtrend.
- $\alpha$ (Acceleration Factor): The sensitivity multiplier. Wilder established standard defaults:
- Starts at 0.02 on the first bar of a new trend.
- Increases by 0.02 each time a new Extreme Point is registered.
- Reaches a maximum cap of 0.20, preventing the trailing stop from hugging price action too tightly.
Because $\alpha$ expands each time price registers a fresh high or low, the distance between the SAR dots and the candlesticks narrows rapidly over time, tracing an accelerating parabolic curve on the chart.
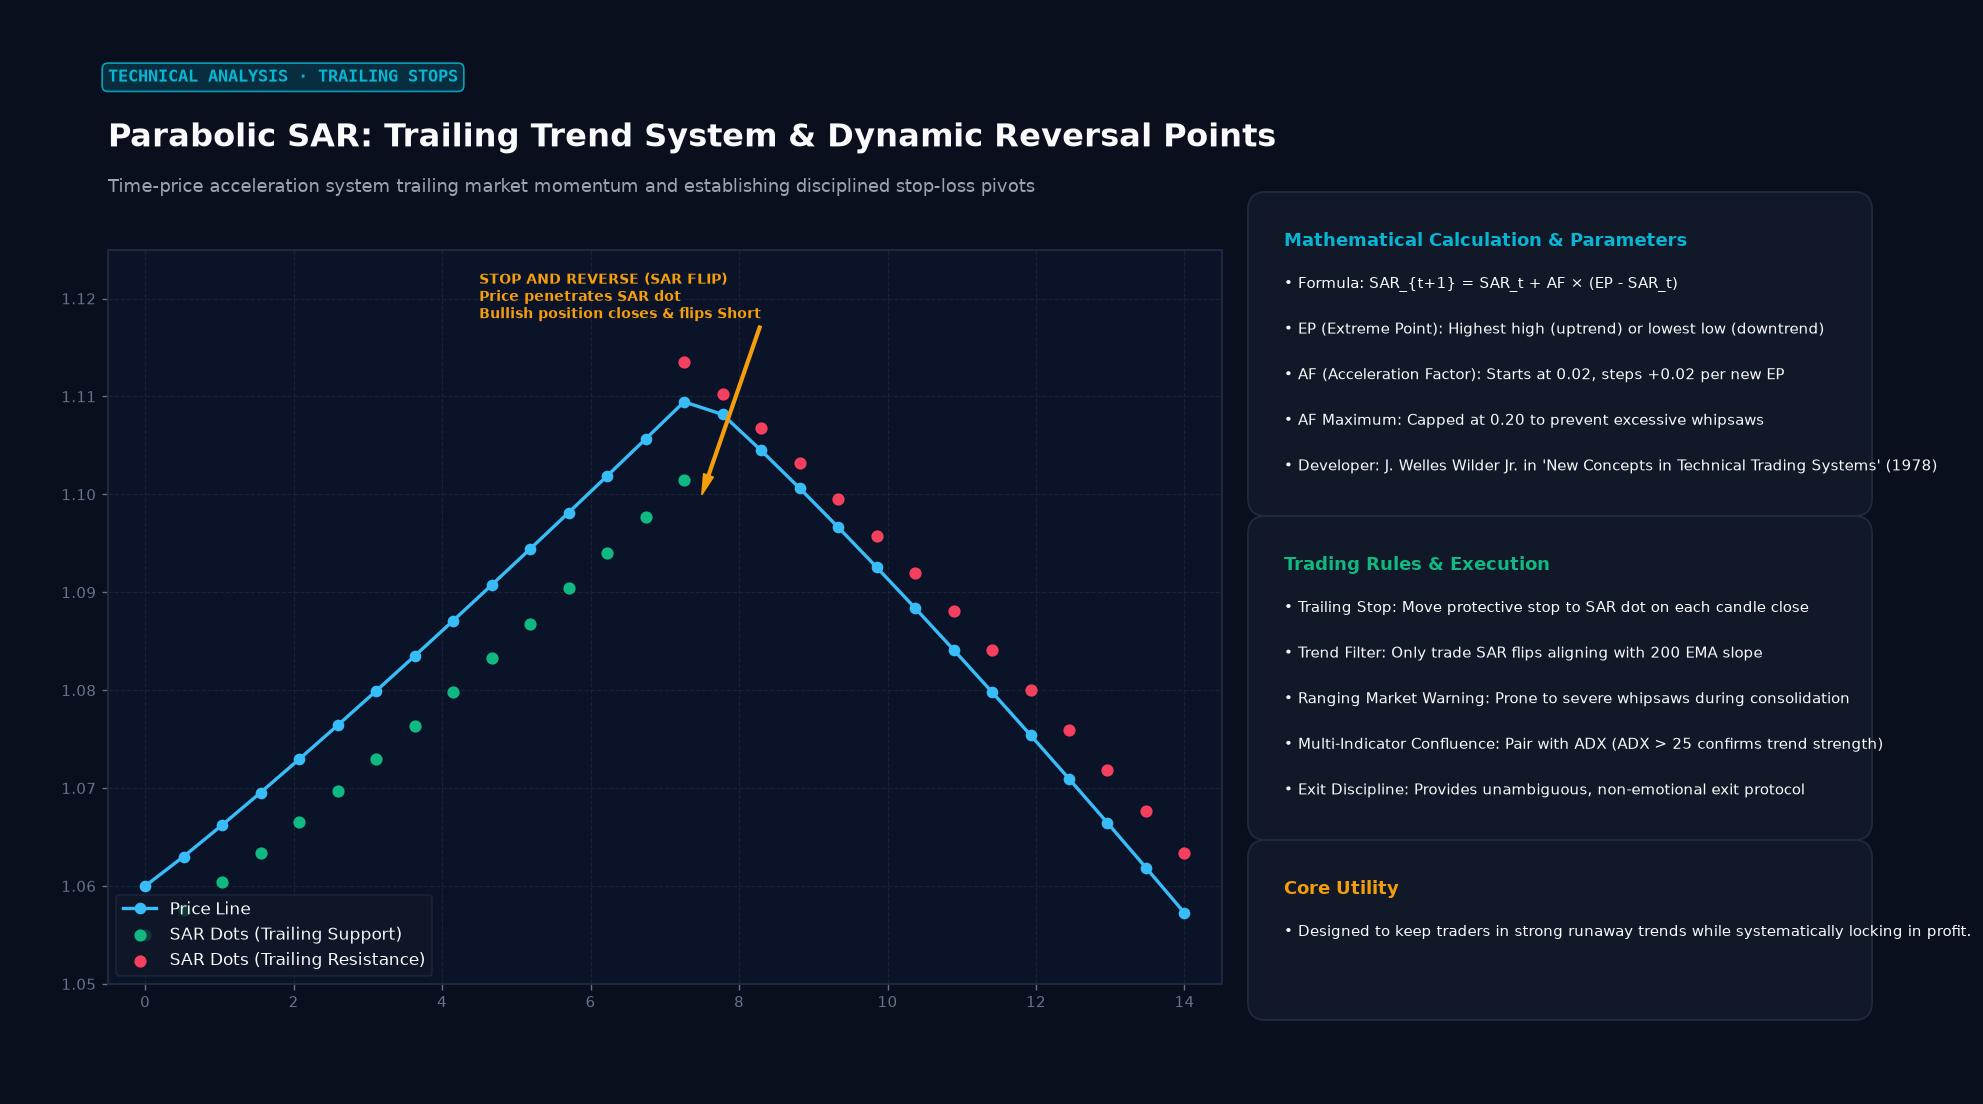 Figure: Time-price acceleration system trailing market momentum and establishing disciplined stop-loss pivots
How to Read Parabolic SAR Signals
- Dots Placed Below Price: Confirms an active uptrend. Traders maintain long positions or use the rising dots as dynamic trailing stop-loss orders.
- Dots Placed Above Price: Confirms an active downtrend. Traders maintain short positions and adjust their stop-loss down along with the descending dots.
- The “Stop and Reverse” Flip: When price action touches or breaches the current SAR dot, the trend is considered exhausted. The existing position is immediately closed (stopped out), and a new position is initiated in the opposite direction (reversed).
| Parameter | Standard Default | Fast/Sensitive Setting | Slow/Smooth Setting |
|---|---|---|---|
| Initial Step ($\alpha$) | 0.02 | 0.03 to 0.05 | 0.01 |
| Maximum Step ($\alpha_{\max}$) | 0.20 | 0.25 to 0.30 | 0.15 |
| Characteristics | Balanced trend capture | Faster exits; higher whipsaw risk | Wider breathing room; delayed exits |
| Best Trading Style | Daily & 4-hour swing trading | 5-min & 15-min momentum scalping | Multi-month position trading |
Best Practices: Combining SAR with Trend Filters
Wilder originally designed the Parabolic SAR as a standalone, always-in-the-market trading system. However, in modern foreign exchange markets, applying the SAR in isolation during choppy, range-bound market regimes produces devastating whipsaws:
- Pairing with the ADX (Average Directional Index): Only take Parabolic SAR signals when the ADX is reading above 25. When ADX is below 20, the market is consolidating; SAR dots will flip back and forth repeatedly, draining account capital.
- Pairing with a 200-period EMA: Use the 200 EMA as a directional filter. Only take bullish SAR flips when price trades above the 200 EMA; only take bearish SAR flips when price trades below the 200 EMA.
Practical Example: Trailing an AUD/USD Trend Trade
Consider a swing trader tracking AUD/USD on a 4-hour chart following an unexpected interest rate hike from the Reserve Bank of Australia:
- Trend Ignition: AUD/USD is trading above its 200-period EMA at 0.6550. The ADX rises to 28, indicating strong directional trend strength.
- Entry Trigger: Price bursts through resistance at 0.6580. The Parabolic SAR flips from above price to below price, printing its first dot at 0.6520. The trader enters long at 0.6585 with an initial stop at 0.6520.
- The Parabolic Trail:
- Day 2: AUD/USD pushes to 0.6640 (new Extreme Point). The Acceleration Factor rises from 0.02 to 0.04, pulling the SAR dot upward to 0.6565.
- Day 4: The currency pair reaches 0.6720. Successive new highs elevate $\alpha$ to its maximum cap of 0.20. The SAR dot accelerates aggressively to 0.6660, guaranteeing locked-in profit of at least 75 pips.
- The Exit: On Day 6, the rally cools. AUD/USD pulls back from 0.6740 to 0.6685, penetrating the active SAR dot sitting at 0.6690.
- Trade Resolution: The trader’s trailing stop triggers at 0.6690, banking a clean $+105$ pip gain without attempting to guess the exact market top.
Key Takeaways
- Dynamic Trailing Stop: Parabolic SAR provides an objective, automated mathematical system for trailing stops behind profitable trades.
- Acceleration Factor: The multiplier increases from 0.02 to a cap of 0.20 each time the market makes a fresh swing high or low, creating an accelerating parabolic trajectory.
- Time Decay Principle: The indicator accounts for time; if price stagnates, the SAR dots continue to catch up, forcing an exit if momentum wanes.
- Consolidation Weakness: Parabolic SAR fails during sideways markets, generating rapid false reversals.
- Essential Filters: Professional currency traders pair the indicator with trend strength gauges (like ADX) and long-term moving averages to filter out low-probability signals.
Frequently Asked Questions
Can the Parabolic SAR be used for day trading?
Yes. Day traders frequently use the Parabolic SAR on 5-minute and 15-minute charts during high-volume sessions (such as the London-New York overlap). However, they generally increase the acceleration step slightly (e.g., 0.03) and avoid trading during quiet market hours.
What should I do when a Parabolic SAR dot flips in a range?
In a sideways or range-bound market, do not reverse your position each time a dot flips. Turn off or ignore Parabolic SAR signals when indicators like ADX or Bollinger Bands reveal that the market has entered a horizontal consolidation phase.
Should I enter a trade solely because a Parabolic SAR dot appeared?
No. Entering solely on a SAR dot flip often leads to poor entry pricing, as the dot flip occurs only after price has already moved significantly in the new direction. Use Parabolic SAR primarily as a trailing exit tool while relying on support/resistance breakouts or moving average pullbacks for your initial entry.
Ready to trade forex?
Open a free demo account with a regulated broker. Practice with virtual funds before risking real money.