Relative Strength Index (RSI)
The Relative Strength Index (RSI) is a momentum oscillator developed by J. Welles Wilder Jr. in 1978. It measures the speed and magnitude of recent price changes on a scale of 0 to 100, helping traders identify overbought conditions (above 70), oversold conditions (below 30), and momentum divergences.
What the RSI Is Actually Telling You
J. Welles Wilder Jr. introduced the RSI in his 1978 book New Concepts in Technical Trading Systems. Nearly 50 years later, it remains one of the most widely used technical indicators in the world — which is both a testament to its usefulness and, occasionally, a source of frustration when crowded positioning distorts its signals.
The RSI doesn’t measure price direction. It measures momentum — specifically, how forcefully price is moving in either direction. An RSI reading of 72 doesn’t mean “price is about to fall.” It means recent upward closes have been significantly stronger than recent downward closes. Whether that strength continues or exhausts depends on context the indicator alone can’t provide.
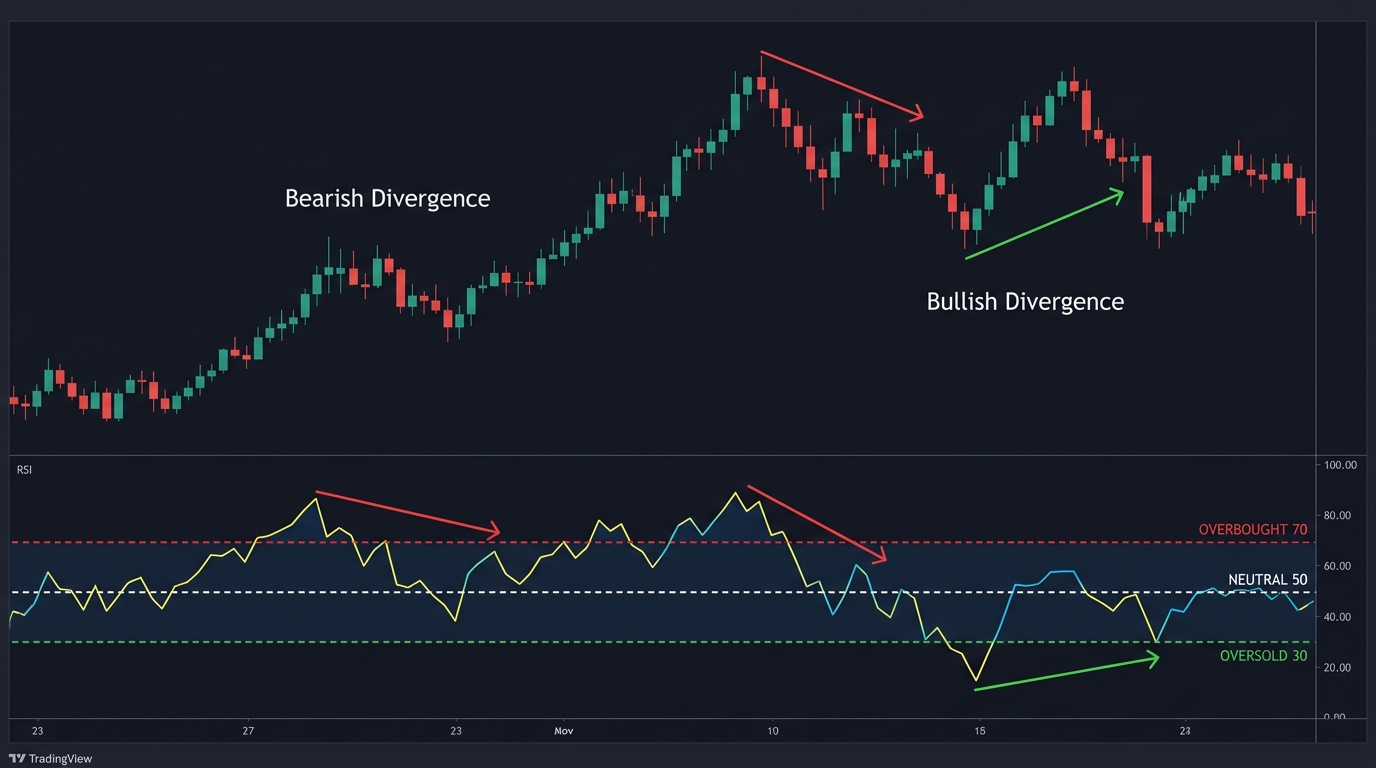
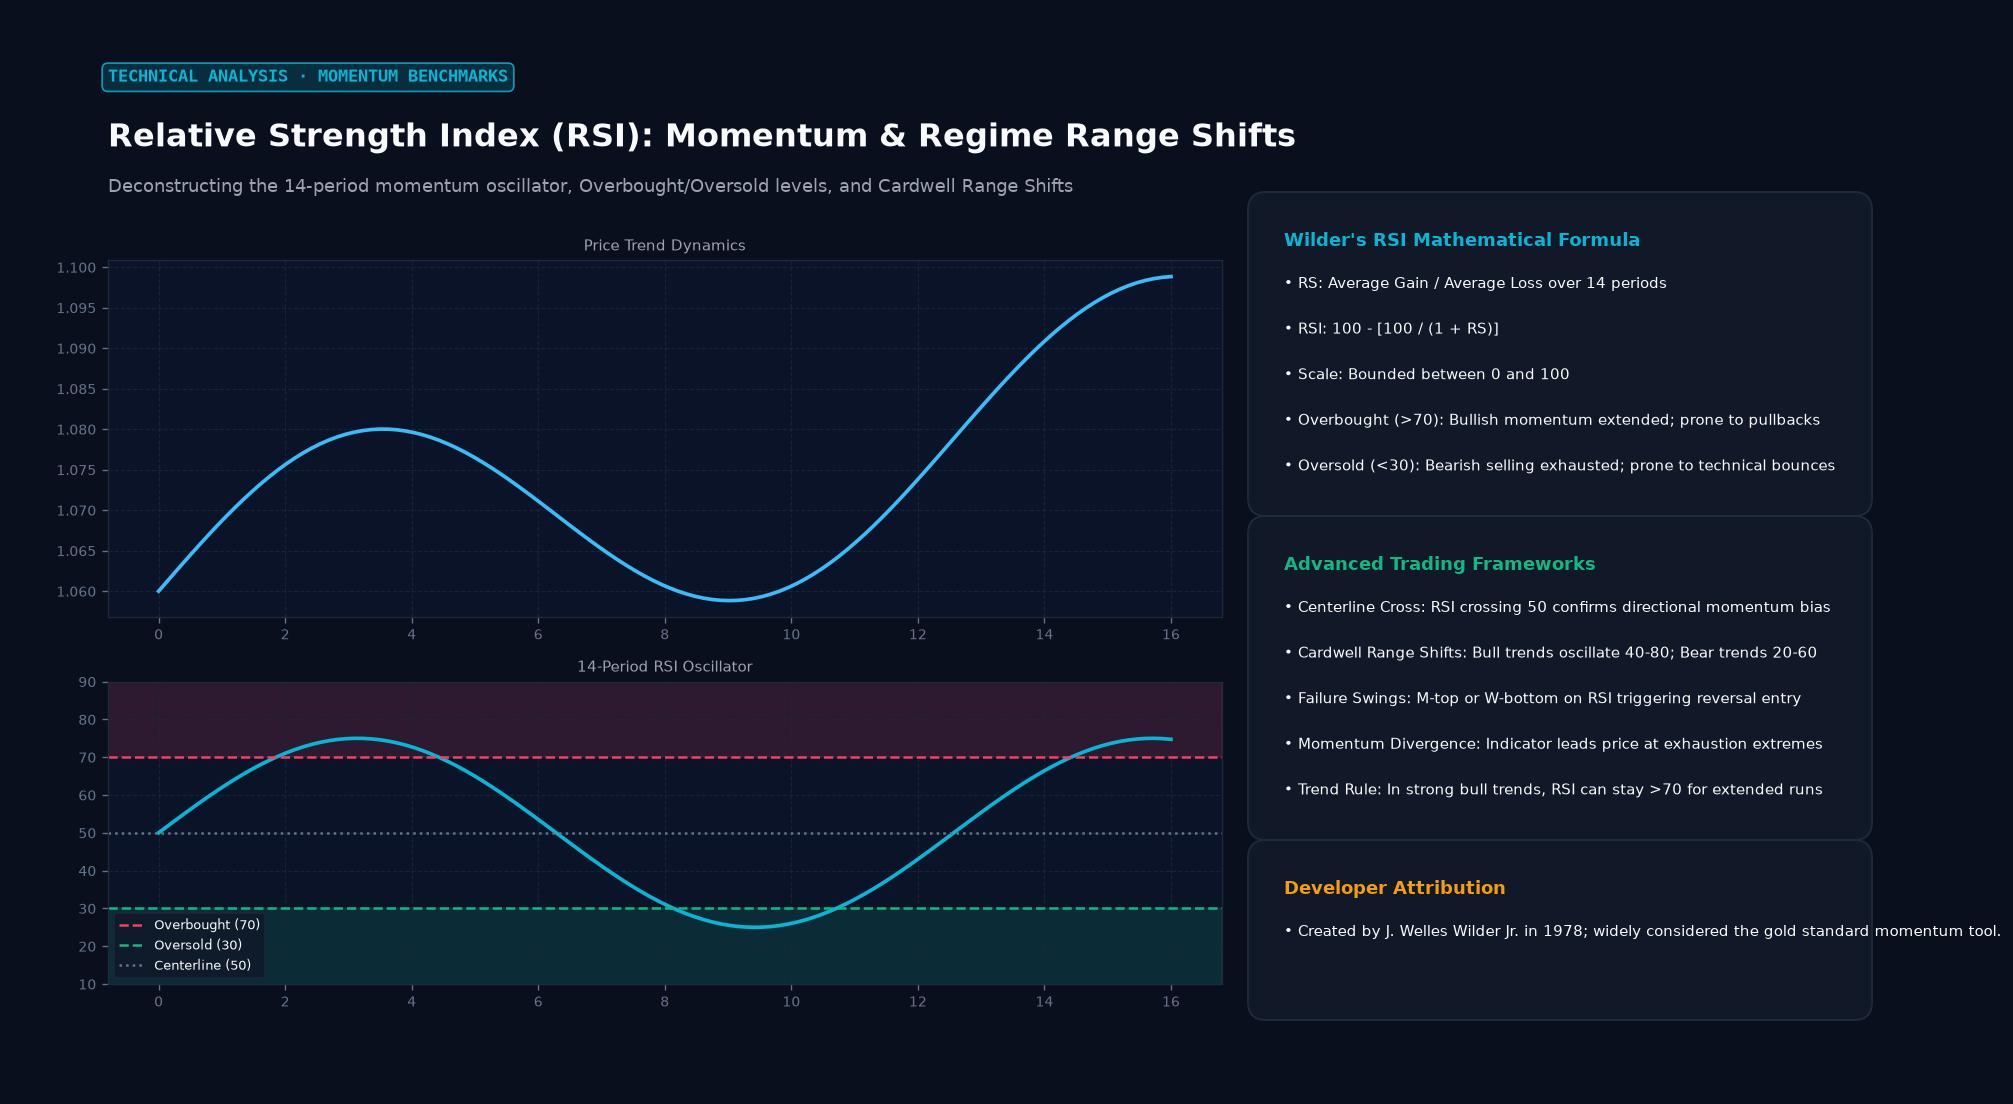 Figure: Deconstructing the 14-period momentum oscillator, Overbought/Oversold levels, and Cardwell Range Shifts
The Formula (and Why It Matters)
RSI = 100 − [100 / (1 + RS)]
Where RS = Average Gain over N periods / Average Loss over N periods
The default lookback period is 14 — Wilder’s original setting. Over the most recent 14 candles, the RSI compares the average size of up-closes to the average size of down-closes. When buyers dominate, the ratio is large and RSI trends toward 100. When sellers dominate, the ratio shrinks and RSI trends toward 0.
A key detail that trips up many traders: RSI uses a smoothing mechanism called Wilder’s EMA (exponential moving average with a specific weighting). This means the RSI value is influenced by all historical price data since inception, not just the last 14 bars. A fresh 14-period RSI calculation and a RSI calculated from 1,000 bars of history on the same instrument will give slightly different numbers.
Overbought and Oversold: The Standard Reading
Wilder defined levels above 70 as overbought and below 30 as oversold. In practice, the interpretation depends heavily on trend context.
In a strong uptrend, RSI regularly reaches and sustains levels of 70–85 without significant reversal. Shorting every time RSI crosses 70 during a bull run is a reliable way to fight the trend and lose. During strong downtrends, RSI frequently stays depressed in the 15–35 range for extended periods.
Andrew Cardwell’s later research on RSI (which Wilder himself endorsed) proposed adjusting the thresholds based on trend: in an uptrend, use 40 as oversold and 80 as overbought. In a downtrend, use 60 as overbought and 20 as oversold. This context-adjusted approach produces meaningfully fewer false signals.
Divergence: The RSI’s Most Powerful Signal
RSI divergence is where the indicator earns its reputation. It occurs when price and RSI disagree about trend momentum:
Bearish divergence: Price makes a new high, but RSI makes a lower high. Momentum is weakening even as price reaches fresh extremes. This often precedes a significant reversal.
Bullish divergence: Price makes a new low, but RSI makes a higher low. Sellers are losing force. The next push down might be the last.
The most reliable divergences appear on higher timeframes (daily and 4-hour charts) and when RSI is simultaneously in overbought or oversold territory. A bearish divergence at RSI 74–78 is more significant than one at RSI 52.
One nuance: divergences can persist for multiple bars before resolving. They’re not immediate triggers — they’re advance warning signals that require a price confirmation (e.g., a break of a trend line or a reversal candlestick pattern) before acting.
RSI Centerline Crossovers
The 50 level on RSI is the midpoint — neither bullish nor bearish momentum is dominant. Crossings of the 50 line can function as trend filters:
- RSI crossing above 50: bullish momentum building, favor long setups
- RSI dropping below 50: bearish momentum dominant, favor short setups
Used as a filter rather than a primary signal, the 50-line crossover helps traders stay on the right side of intermediate-term momentum without chasing extreme readings.
Adjusting the Period
Changing from the default 14-period RSI has meaningful effects:
Shorter periods (7–9): More sensitive, more signals, more noise. Useful for very active short-term traders. 7-period RSI reaches overbought/oversold territory much more frequently.
Longer periods (21–25): Smoother, fewer signals, higher reliability. The 21-period RSI is popular among swing traders who want fewer but higher-conviction setups.
The two-period RSI (popularized by Larry Connors) is an extreme short-term version that treats any reading below 10 as deeply oversold in an uptrend — a timing tool for aggressive mean-reversion entries in trending stocks and ETFs.
Key Takeaways
- RSI measures momentum on a 0-100 scale; above 70 = overbought, below 30 = oversold
- In strong trends, RSI can stay overbought or oversold far longer than expected
- Divergence (price and RSI moving in opposite directions) is the indicator’s most reliable signal
- The 50-level crossover is a useful momentum filter for trade direction bias
- Adjusting the period changes sensitivity — shorter = more signals; longer = fewer, more reliable
FAQ
Should I change RSI settings from the default 14? Only if you have backtested evidence that different settings improve performance for your specific strategy and timeframe. Changing settings to fit recent price action is curve-fitting — it looks better in hindsight but not in live trading.
Can RSI predict price reversals reliably? No indicator predicts reversals reliably in isolation. RSI divergence at key support/resistance levels, combined with confirmatory candlestick patterns, produces better odds — but “better odds” still means a meaningful percentage of false signals. Treat it as one component of a multi-factor decision, not a standalone trigger.
Ready to trade forex?
Open a free demo account with a regulated broker. Practice with virtual funds before risking real money.