Point and Figure Charts
A Point and Figure (P&F) chart is a non-time-based technical charting method that filters out minor market noise by plotting price movements using columns of alternating X's (for rising prices) and O's (for falling prices), advancing only when price changes by a predefined box size.
What Are Point and Figure (P&F) Charts?
Point and Figure (P&F) charting is one of the oldest and most disciplined technical analysis methodologies, dating back to the late 19th century when Charles Dow and early floor traders tracked prices on paper without the aid of computers. Unlike conventional candlestick, bar, or line charts—which plot price on the vertical axis against regular time intervals (such as 1-hour or 1-day) on the horizontal axis—a Point and Figure chart completely disregards time and trading volume.
A P&F chart advances across columns strictly when the price of the asset moves by a specified magnitude, known as the box size. It utilizes two universal symbols:
- Columns of “X”s: Represent rising prices (buying pressure).
- Columns of “O”s: Represent falling prices (selling pressure).
By filtering out insignificant intraday fluctuations, low-volatility sideways consolidation, and calendar noise, P&F charts provide traders with clean, unambiguous horizontal support and resistance levels, dynamic 45-degree trendlines, and objective breakout signals.
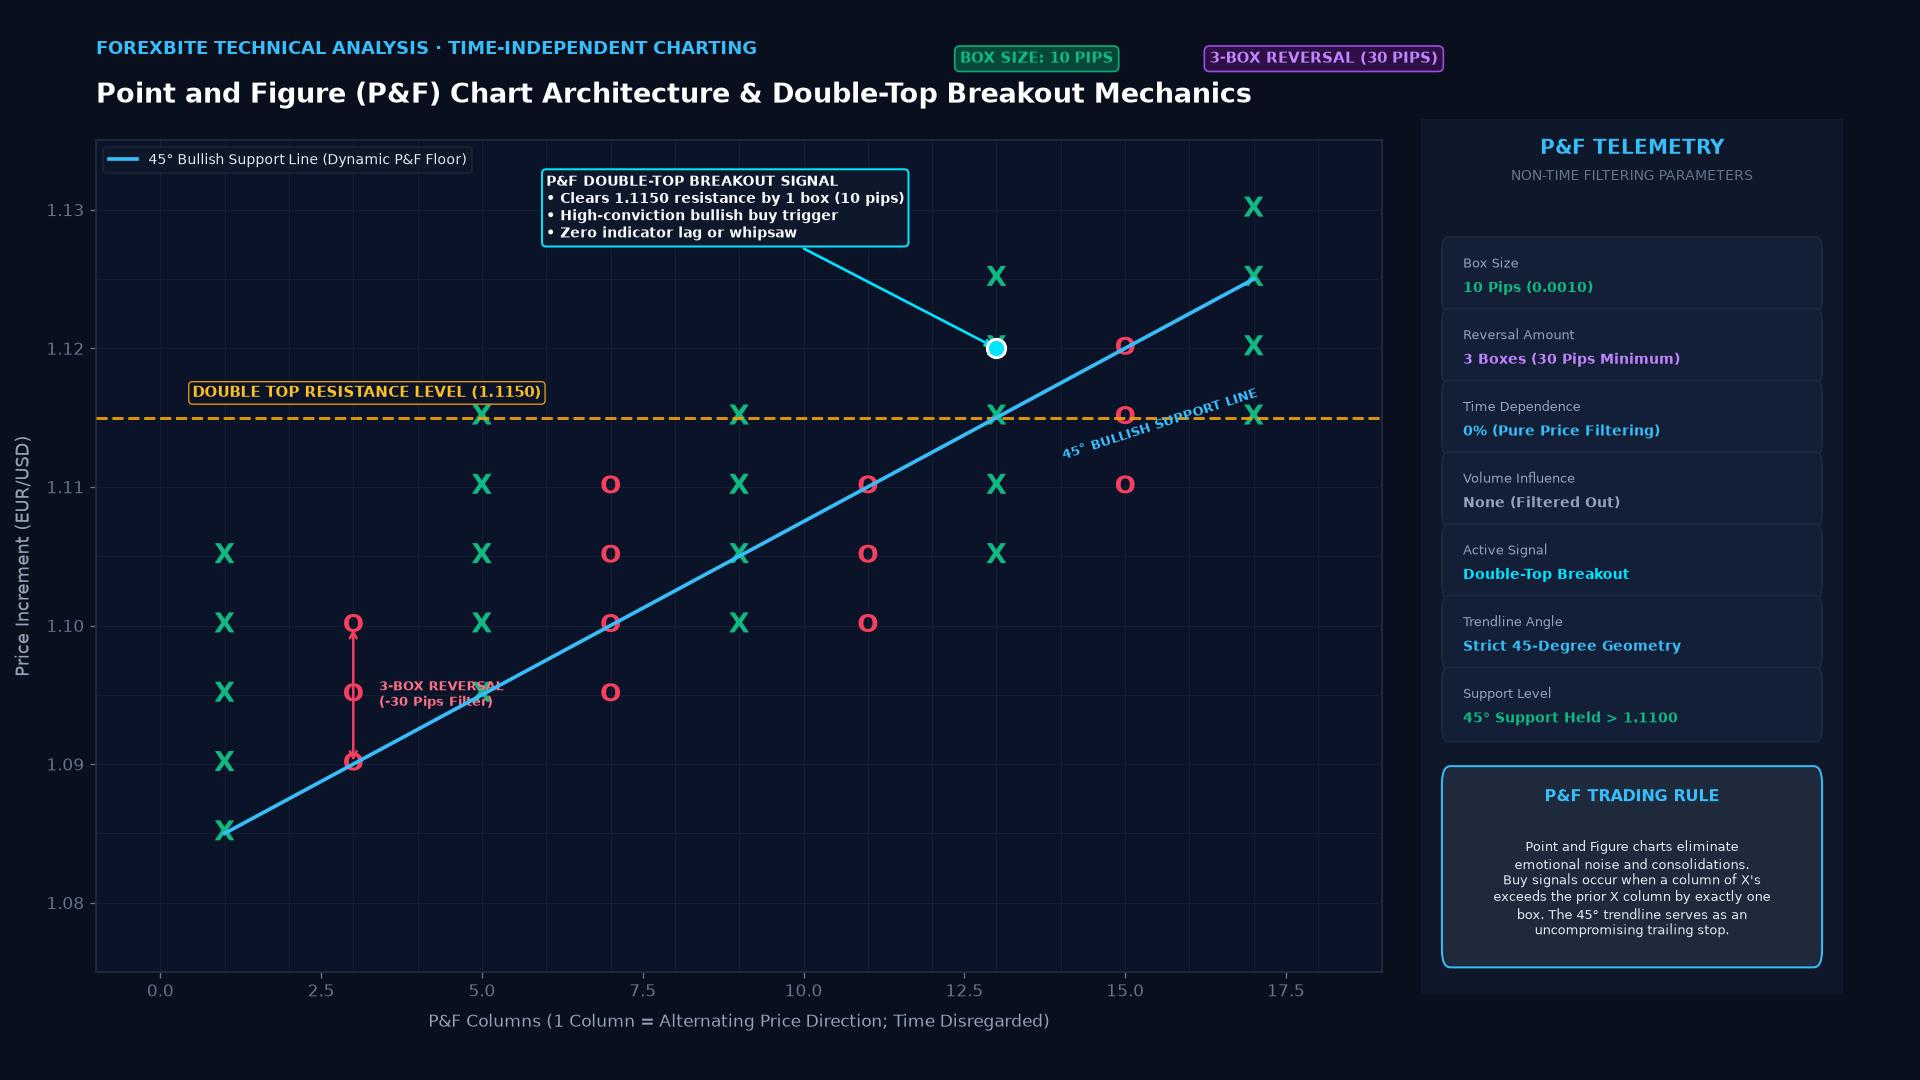 Figure: Point and Figure (P&F) chart structure illustrating columns of X’s (rallies) and O’s (declines), 10-pip box size, 3-box reversal filter, 45-degree bullish support line, and double-top breakout trigger.
Core Construction Parameters: Box Size and Reversal Amount
To construct a Point and Figure chart, a trader or algorithmic model must define two critical mathematical parameters:
1. Box Size
The box size represents the minimum increment of price movement required to plot a new symbol in the current column:
- In spot forex, a box size might be set to 10 pips (0.0010) or 20 pips (0.0020).
- In equities, a traditional percentage box scale or fixed dollar increment (e.g., $1.00 or $2.00) is used.
- If the price moves by less than the box size, no new symbol is drawn, regardless of how much time passes.
2. Reversal Amount
The reversal amount dictates how many boxes the price must move in the opposite direction to justify starting an entirely new column.
- The overwhelming industry standard is the 3-Box Reversal Chart: $$\text{Reversal Requirement} = \text{Box Size} \times 3$$
- For example, on a 10-pip box chart, if the current column is a rising column of X’s, the price must decline by at least 30 pips from the highest plotted X before a new column of O’s is initiated.
Unique Analytical Rules of Point and Figure Charting
P&F charts possess distinctive technical conventions that separate them from standard time-series analysis:
| Rule / Pattern | Conventional Time Chart | Point and Figure (P&F) Chart |
|---|---|---|
| Horizontal Axis | Uniform calendar time (e.g., 1 day per bar). | Flexible; advances only when a column reversal occurs. |
| Support & Resistance | Subjective horizontal zones and wick rejections. | Highly objective; calculated by exact integer counts of boxes. |
| Trendlines | Connecting arbitrary swing highs and swing lows. | Drawn strictly at 45-degree angles regardless of scale. |
| Price Projections | Fibonacci expansions and measured moves. | Mathematical Horizontal and Vertical Count methods. |
| Noise Sensitivity | Highly sensitive to intraday wicks and false ticks. | Immune to noise; ignores all moves smaller than the box size. |
The 45-Degree Trendline Framework
A defining hallmark of P&F charting is the use of strict 45-degree geometric trendlines:
- Bullish Support Line: Drawn upward at an exact 45-degree angle starting from a confirmed major column low. As long as price columns remain above this line, the macro trend is strictly bullish.
- Bearish Resistance Line: Drawn downward at an exact 45-degree angle starting from a confirmed major column peak. As long as columns remain below this line, only short breakout setups are permitted.
                  45-DEGREE P&F TRENDLINE GEOMETRY

            Price
              ^
              |               X
              |           X   X
              |       X   X   O   X
              |   X   X   O       X
              |   X   O   /----------------- 45-Degree Bullish Support Line
              |   O      /
              |         /
              +--------+------------------------> Columns
Price Target Projections: The Horizontal Count Method
P&F analysis features an objective method for projecting future price targets based on the width of the consolidation base:
$$\text{Projected Price Move} = \text{Consolidation Width (Columns)} \times \text{Reversal Amount} \times \text{Box Size}$$
If a currency pair consolidates within a tight trading range that spans 8 columns on a 20-pip box, 3-box reversal chart, the projected breakout target is: $$\text{Projected Target} = 8 \times 3 \times 20 \ \text{pips} = \mathbf{480 \ \text{pips}}$$ Adding 480 pips to the breakout level provides an institutional objective that reflects the potential energy accumulated during the consolidation.
Real-World Case Study: P&F Breakout on EUR/USD
In late 2020, EUR/USD was consolidating in a multi-month range between 1.1600 and 1.2000. An institutional currency desk monitored a 20-pip box, 3-box reversal P&F chart:
- Consolidation Pattern: Price formed a textbook Double Top Breakout pattern as a column of X’s reached 1.2020, exceeding the prior column high of 1.2000.
- The Filter: On standard daily candlestick charts, multiple intraday spikes above 1.2000 had resulted in false breakouts. However, the P&F chart required price to close a full 20-pip box above the level (1.2020), confirming institutional buying.
- The Projection: The horizontal consolidation base spanned 12 columns across the 1.1800 midpoint: $$\text{Target} = 12 \ \text{columns} \times 3 \ \text{reversal} \times 0.0020 \ \text{box} = +0.0720 \ (720 \ \text{pips})$$ $$\text{Projected Target Level} = 1.1600 + 0.0720 = \mathbf{1.2320}$$
- Outcome: EUR/USD rallied relentlessly over the subsequent eight weeks, topping out at exactly 1.2349 in early January 2021 before reversing, hitting the P&F projected target with extraordinary accuracy.
Frequently Asked Questions
Can Point and Figure charts be used for intraday scalping?
Yes. By reducing the box size (e.g., using a 2-pip or 5-pip box size with 1-minute or tick data), scalpers can filter out bid-ask spread chop and identify clean micro-breakouts during liquid London and New York market sessions.
What is the difference between a Double Top in P&F vs. Candlestick charts?
In candlestick analysis, a Double Top is a bearish reversal pattern where price fails to break a prior high twice. In Point and Figure analysis, a Double Top Breakout is a bullish continuation signal where a column of X’s rises one box above the highest X of the preceding column of X’s.
How does High/Low versus Closing Price charting work in P&F?
Traders can construct P&F charts using either daily High/Low extremes or Closing prices. Institutional practitioners generally favor High/Low data to ensure intraday volatility extremes are captured, whereas closing-price P&F charts provide maximum smoothing for long-term multi-year trends.
Ready to trade forex?
Open a free demo account with a regulated broker. Practice with virtual funds before risking real money.