Reversal
A reversal is a definitive change in the primary directional trend of an asset's price—transitioning from an established uptrend into a downtrend (bearish reversal) or from a downtrend into an uptrend (bullish reversal)—characterized by a structural shift in swing highs and swing lows.
What Is a Reversal?
In technical market analysis and price action trading, a reversal represents a structural turning point where prevailing market forces exhaust their momentum and the counterparty gains decisive control, permanently redirecting price action.
A reversal occurs in one of two directional forms:
- Bearish Reversal (Top): An established uptrend characterized by consecutive higher highs (HH) and higher lows (HL) terminates, transitions through an accumulation or distribution phase, and begins printing lower highs (LH) and lower lows (LL).
- Bullish Reversal (Bottom): An established downtrend characterized by lower highs and lower lows exhausts its selling pressure, absorbs supply, and begins printing higher highs and higher lows.
Unlike a temporary retracement or reaction—which is merely a short-term pullback within the larger ongoing macro trend—a true reversal signals the complete breakdown of existing market structure and the birth of a new trend regime.
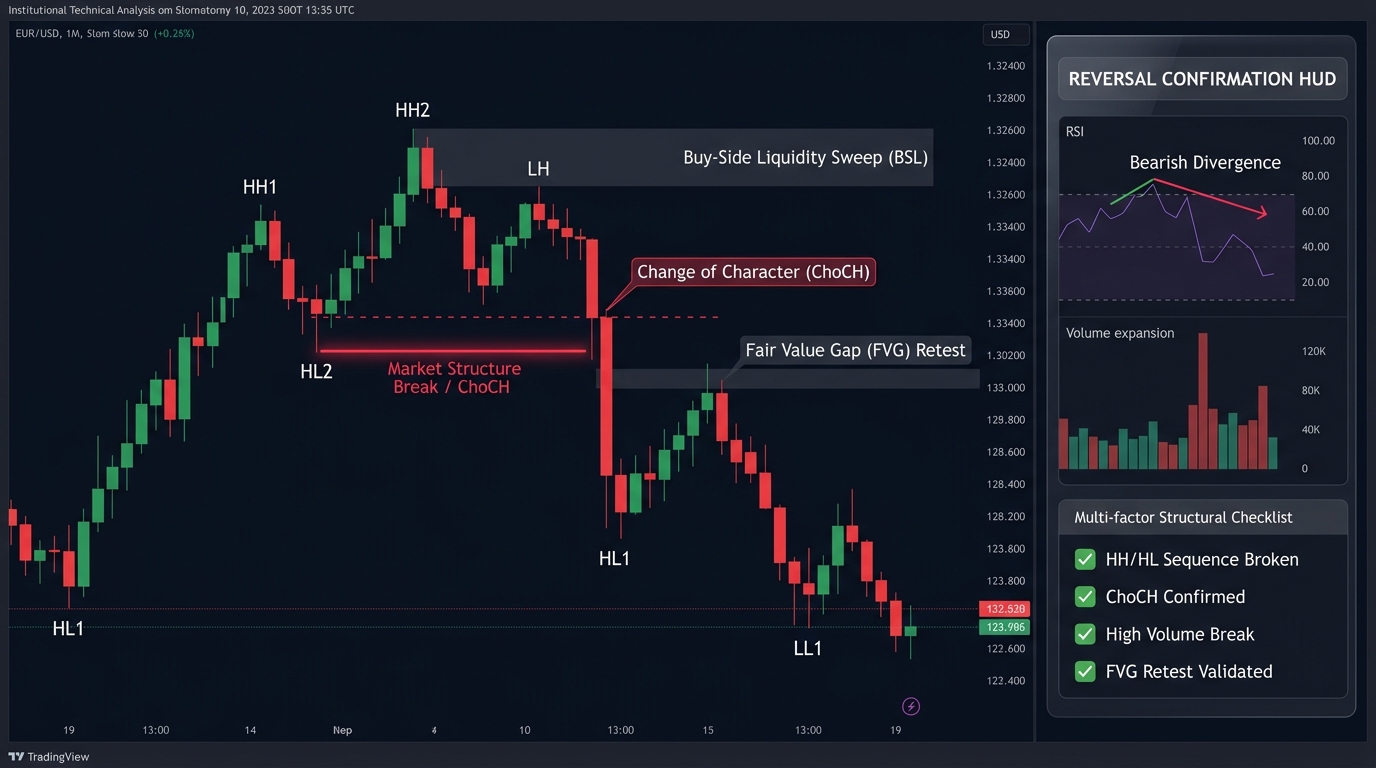
Market Structure Shift (MSS) and Break of Structure
In modern institutional price action (Smart Money Concepts), a reversal is not confirmed merely by an indicator crossing or a candle changing color; it requires an objective Market Structure Shift (MSS):
- Uptrend Rule: In an uptrend, every pullback low is protected as a Swing Low (Higher Low). As long as price remains above the most recent key Higher Low, the uptrend remains structurally intact.
- The Invalidation (ChoCH / Change of Character): When price fails to make a new higher high and subsequently closes with a full candle body below the previous swing low, a Market Structure Break occurs.
- The Confirmation: The market rallies weakly back toward the broken support level (retesting it as new resistance), printing a Lower High (LH) before expanding downward to print a Lower Low (LL), confirming the bearish reversal.
Primary Technical Reversal Patterns
Classical charting identifies several reliable geometric patterns that signal impending macro reversals:
| Reversal Pattern | Trend Regime | Key Structural Components | Institutional Market Psychology |
|---|---|---|---|
| Head and Shoulders | Reverses an Uptrend to Downtrend | Left Shoulder, higher Head, lower Right Shoulder, and a horizontal/sloping Neckline. | Institutional distribution; buyers fail to defend the right shoulder, and sellers trigger stop-losses below the neckline. |
| Inverse Head and Shoulders | Reverses a Downtrend to Uptrend | Left Shoulder, lower Head (capitulation low), higher Right Shoulder, and Neckline. | Institutional accumulation; sellers are exhausted, and smart money steps in to establish a long-term bottom. |
| Double Top (“M” Pattern) | Reverses an Uptrend to Downtrend | Two distinct peaks testing the same resistance ceiling, separated by a central swing trough. | Heavy institutional resistance absorbs buying; breakout below the intervening swing low confirms the reversal. |
| Double Bottom (“W” Pattern) | Reverses a Downtrend to Uptrend | Two distinct troughs testing the same support floor, separated by an intervening swing high. | Sellers fail to push price lower on the second test; breakout above the swing high confirms the bottom. |
Technical Indicators for Confirming Reversals
Professional quantitative and discretionary traders require multiple confluence filters before declaring a reversal:
1. Momentum Divergences (RSI / MACD)
A Regular Divergence occurs when the price chart prints a higher high (or lower low), but the momentum oscillator fails to confirm the move by printing a lower high (or higher low). Divergences indicate that internal market velocity is decaying rapidly, leaving price vulnerable to an imminent reversal.
2. Climax Volume (Capitulation Bars)
Major macro market bottoms are frequently characterized by selling climaxes: an enormous, extraordinary spike in trading volume accompanied by a wide-range candle with a massive lower rejection wick (a hammer candle). This reveals that aggressive institutional buyers have absorbed all panic selling from liquidated retail accounts.
       REVERSAL CONFIRMATION CONFLUENCE CHECKLIST

  [Price Action]      Decisive Break below Previous Swing Low (MSS)
                            +
  [Momentum]          Pronounced Bearish Divergence on RSI / MACD
                            +
  [Candlestick]       Bearish Engulfing or Shooting Star at Key Resistance
                            +
  [Volume]            Surge in Volume on the Breakout Candle
                            ||
              HIGH-PROBABILITY REVERSAL EXECUTION
Reversal vs. Pullback (Retracement): Key Differences
The most critical trading skill is distinguishing between a minor pullback and a full structural reversal:
| Diagnostic Metric | Healthy Pullback (Reaction) | True Structural Reversal |
|---|---|---|
| Market Structure | Preserves key swing highs and lows; prints higher lows. | Violates and closes below major higher lows (or above lower highs). |
| Fibonacci Depth | Typically terminates within the 38.2% to 61.8% retracement zone. | Punches through the 78.6% and 100% retracement boundaries. |
| Candlestick Momentum | Small, overlapping counter-trend candles with light volume. | Wide-range, aggressive trend candles with heavy volume expansion. |
| Moving Averages | Bounces cleanly off the 20-day or 50-day EMA. | Slices cleanly through the 50-day and 200-day moving averages. |
Real-World Case Study: The October 2022 US Dollar Index (DXY) Reversal
Throughout 2022, the US Dollar Index (DXY) staged a historic parabolic bull rally, driven by aggressive Federal Reserve rate hikes, climbing from 95.00 to a 20-year high of 114.78 in late September 2022:
- The Climax High: In late September, DXY hit 114.78, with the Daily RSI surging above 82.0 (extreme overbought).
- The Divergence: In late October, DXY retested the highs, printing a secondary peak at 113.90. However, the Daily RSI plummeted to 58.0, forming a massive, multi-week Bearish Divergence.
- The Market Structure Break: On November 10, 2022, a softer-than-expected US CPI print was released. DXY crashed through its key swing support at 109.50, breaking its ascending trendline and the 50-day moving average in a single session.
- The New Trend: DXY collapsed from 114.78 down to 100.80 over the subsequent three months, confirming a textbook multi-year macro reversal.
Frequently Asked Questions
What is the safest way to trade a market reversal?
The safest method is to avoid “picking the exact top or bottom.” Instead, wait for the market to formally break structure (MSS) and then enter on the first pullback (retest) of the broken structural level. This provides an objective reference point for a tight stop-loss placed just beyond the extreme swing high or low.
What is a “False Reversal” (Bull or Bear Trap)?
A false reversal occurs when price temporarily breaches a major support or resistance level, enticing traders to enter counter-trend positions, only for the market to immediately reverse and continue aggressively in the direction of the original primary trend.
Which timeframe is most reliable for identifying trend reversals?
Daily and Weekly timeframes provide the most durable and reliable reversal signals. While reversals occur frequently on 1-minute and 5-minute charts, intraday noise and order-flow friction generate a much higher percentage of false breakouts compared to higher-timeframe structural shifts.
Ready to trade forex?
Open a free demo account with a regulated broker. Practice with virtual funds before risking real money.