Range
In financial trading, range refers to: (1) the mathematical difference between the highest and lowest price reached by an asset over a specified time interval; or (2) a sideways market structure where price oscillates horizontally between established support and resistance boundaries.
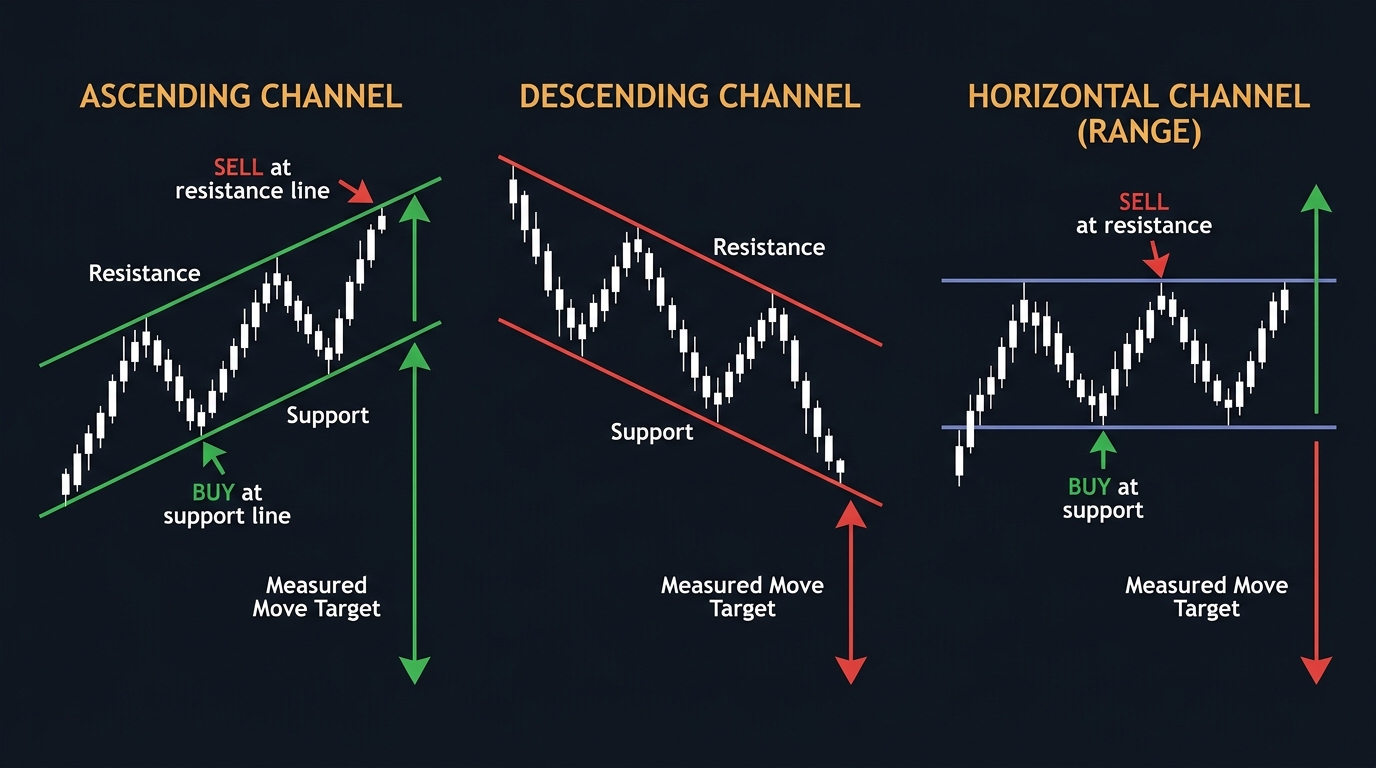
What Is a Range?
In technical market analysis and price action trading, the concept of range is utilized across two interrelated dimensions:
- The Volatility Metric (Statistical Range): The exact numerical distance between the highest recorded price and the lowest recorded price of an instrument during a designated time period: $$\text{Price Range} = \text{High} - \text{Low}$$ It quantifies the total dispersion of price movement and forms the mathematical foundation of key volatility indicators like the Average True Range (ATR).
- The Market Regime (Range-Bound / Consolidation): A horizontal market state where price action is bounded between a distinct upper price boundary (resistance) and a lower price boundary (support). In a range-bound regime, buyers and sellers exist in temporary equilibrium, and neither bulls nor bears can generate sufficient momentum to establish a directional trend.
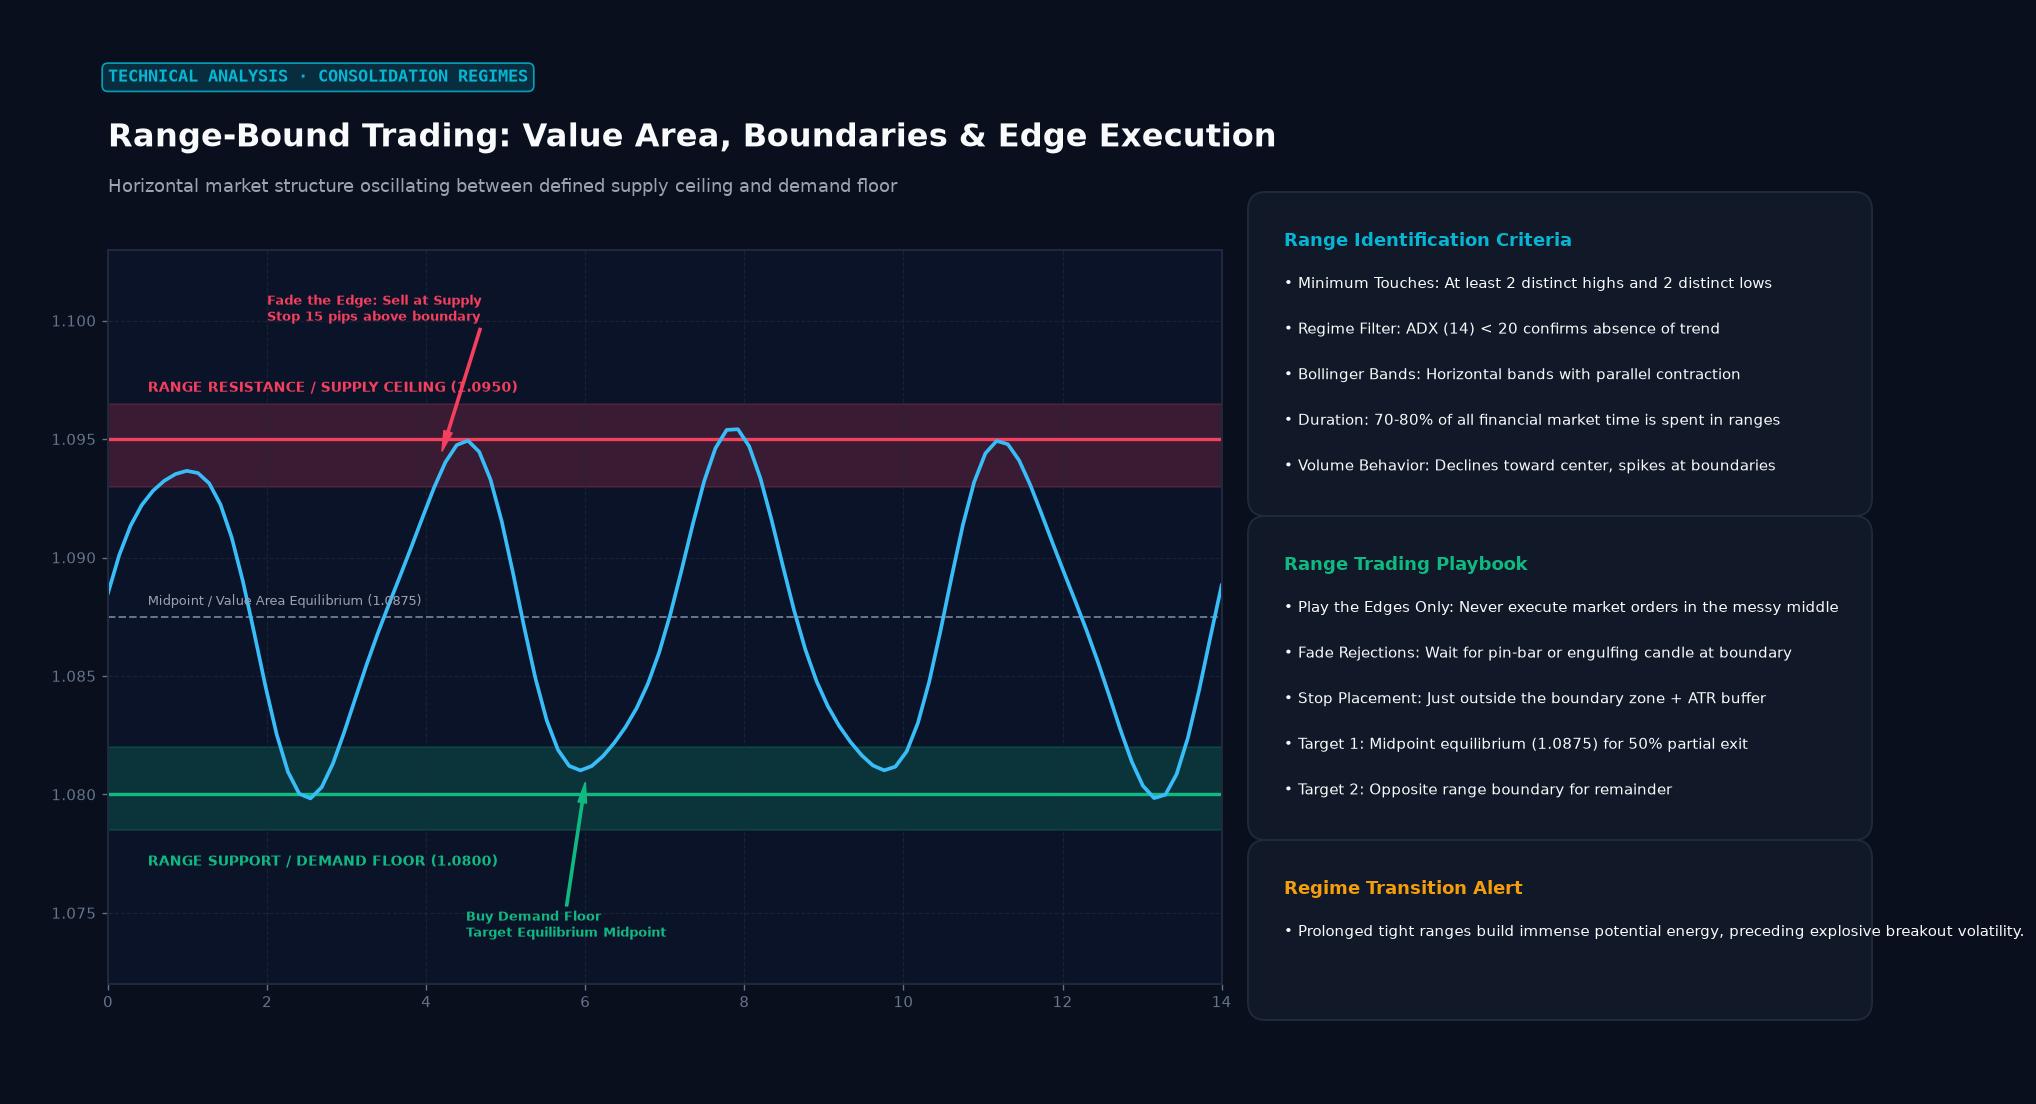 Figure: Horizontal market structure oscillating between defined supply ceiling and demand floor
The Statistical True Range and Average True Range (ATR)
In quantitative volatility measurement, standard high-minus-low range calculation fails to capture overnight gaps. To solve this, J. Welles Wilder Jr. developed the True Range (TR):
$$\text{True Range (TR)} = \max\Big[(\text{High} - \text{Low}), \ |\text{High} - \text{Previous Close}|, \ |\text{Low} - \text{Previous Close}|\Big]$$
Smoothing the True Range over a standard 14-period window yields the Average True Range (ATR):
$$\text{ATR}t = \frac{(\text{ATR}{t-1} \times 13) + \text{TR}_t}{14}$$
- High ATR Readings: Signal expanding volatility, high price velocity, and strong trend impulse.
- Low ATR Readings: Signal volatility compression and tight range-bound consolidation—often the precursor to a violent volatility breakout.
Trending Markets vs. Range-Bound Markets
Financial markets spend approximately 70% to 80% of their time trapped in horizontal ranges, and only 20% to 30% in strong directional trends:
| Structural Feature | Trending Market Regime | Range-Bound (Consolidating) Market |
|---|---|---|
| Market Structure | Consecutive Higher Highs & Higher Lows (Uptrend) or Lower Lows & Lower Highs (Downtrend). | Price oscillates between clear horizontal support and resistance boundaries. |
| Moving Averages | Moving averages slope steeply (e.g., 20/50/200 EMA fan out in order). | Moving averages flatten out and price repeatedly weaves back and forth across them. |
| Oscillators (RSI / Stoch) | Oscillators peg at extremes (> 70 or < 30) for extended periods. | Oscillators bounce cleanly between overbought and oversold thresholds. |
| Volume Distribution | Volume surges on trend breakout impulses; light on pullbacks. | High volume at range edges; low volume in the middle “no-man’s land.” |
| Primary Trading Strategy | Trend following, breakout trading, pullbacks to moving averages. | Mean reversion, fading range extremes, buying support / selling resistance. |
Tactical Strategies for Trading Ranges
Disciplined traders deploy two distinct tactical frameworks when encountering a range:
1. The Range-Bound Mean-Reversion Play (“Fading the Edges”)
- Buy Setup: Wait for price to touch the lower support boundary. Confirm that a momentum oscillator (like Stochastic or RSI) is oversold (< 20 or < 30) and look for a bullish rejection wick. Buy with a tight stop-loss placed just below support, targeting the opposite resistance ceiling.
- Sell Setup: Wait for price to test the upper resistance boundary. Confirm overbought oscillator readings and bearish candle wicks. Sell short with a stop-loss just above resistance, targeting the range floor.
2. The Range Breakout Play
Rather than trading inside the box, breakout traders anticipate the eventual range failure:
- When price consolidates tightly (ATR collapses), orders accumulate above resistance and below support.
- A decisive close outside the range on high volume signals that institutional capital has broken the equilibrium. Breakout traders buy the break or wait for the initial retest of the broken boundary.
       RANGE BREAKOUT & RETEST TRANSMISSION

  Resistance: $1.1000  =======*=======*=========================+
                              / \     / \                       |
  Support:    $1.0800  ======*===*===*===*======================|
                                                          |     |
  Breakout Occurs: Strong Volume Expansion --------------->     v
                                                        Price Breaks to $1.1150
                                                                |
  Retest Setup: Price Pulls Back to Prior Resistance ($1.1000) <-+
                (Prior Resistance Converts to New Support!)
                                                                |
  Bullish Continuation: Trend Accelerates to $1.1300 ---------->
Real-World Case Study: EUR/USD Multi-Month Range in 2023
Between February and June 2023, the European Central Bank and the US Federal Reserve were hiking interest rates in tandem, creating a macroeconomic policy stalemate:
- The Range Boundaries: EUR/USD became locked in a well-defined 350-pip trading range:
- Range Ceiling (Resistance): 1.1080
- Range Floor (Support): 1.0730
- The Mean-Reversion Opportunity: Over four months, price tested the 1.1080 resistance ceiling four separate times and the 1.0730 support floor three times. Oscillators (14-period RSI) repeatedly reached 70 at the top and 30 at the bottom, offering high-probability 200-pip to 300-pip counter-trend swings.
- The Breakout: In early July 2023, a surprisingly soft US CPI print weakened the dollar. EUR/USD surged through 1.1080 on massive volume, triggering a cascade of buy-stop orders and embarking on a rapid 200-pip trend extension to 1.1275 within days.
Frequently Asked Questions
What causes a market to enter a range?
A range forms when the market absorbs conflicting macroeconomic fundamentals, enters a summer or holiday liquidity lull, or consolidates ahead of a major binary event (such as an election or interest rate decision). Neither institutional buyers nor sellers have sufficient conviction to push prices outside the range.
How do I know if a range breakout is real or fake?
A genuine breakout is characterized by a strong daily candlestick body closing completely outside the range boundary, accompanied by a noticeable surge in trading volume and an expanding ATR. A “fakeout” (bull or bear trap) typically spikes outside the boundary with a long wick and immediately closes back inside the range.
What is the “Daily Range” in forex and why is it important?
The Daily Range is the difference between the high and low of the 24-hour trading day. Day traders monitor the Daily Range against the 20-day Average True Range (ATR) to determine if a currency pair has already exhausted its expected daily volatility before entering new trades.
Ready to trade forex?
Open a free demo account with a regulated broker. Practice with virtual funds before risking real money.