Volatility
Volatility is a statistical metric that measures the frequency, magnitude, and velocity of price fluctuations for a financial instrument over a given timeframe, serving as a primary indicator of market risk and trading opportunity.
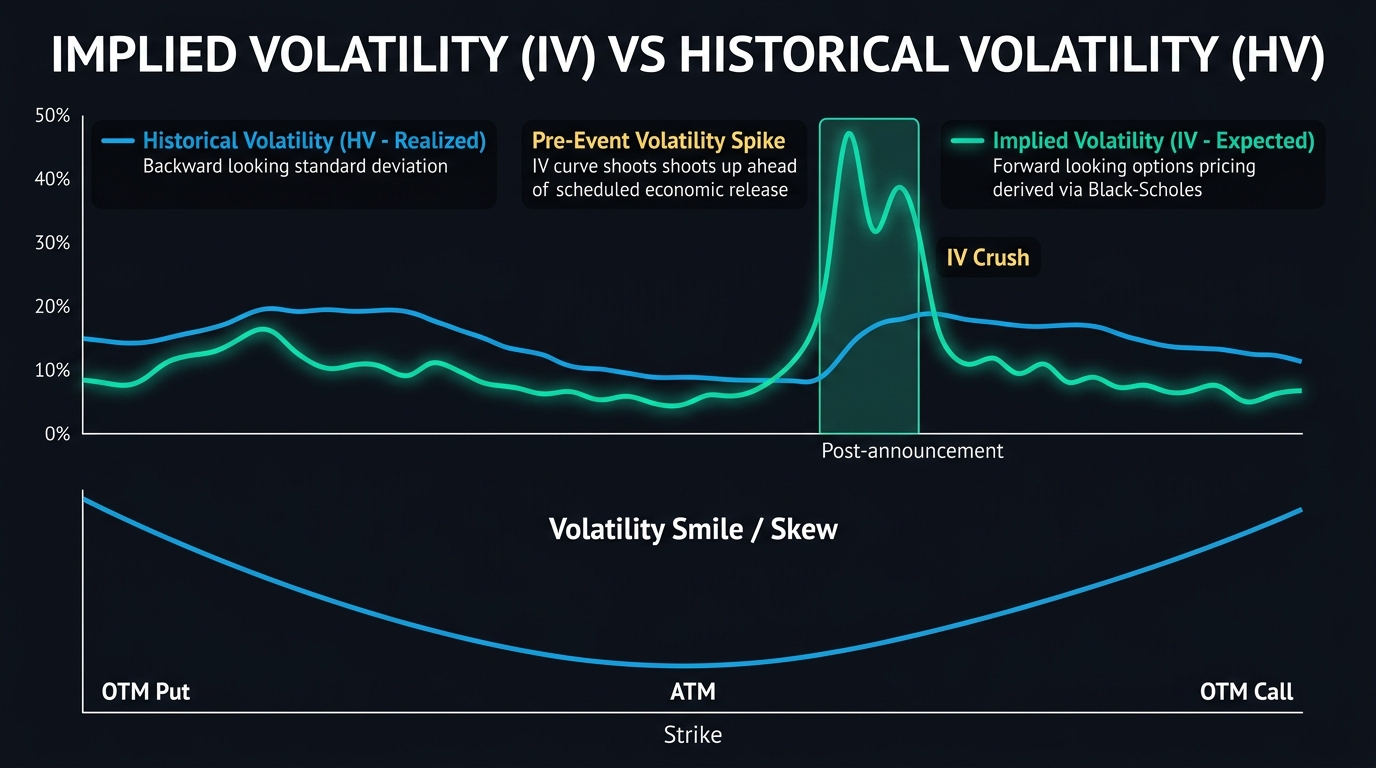
Volatility is the heartbeat of the foreign exchange market. Statistically defined as the dispersion of returns around an asset’s average price over time, volatility reflects how quickly, violently, and widely an exchange rate swings.
For currency traders, volatility is a double-edged sword: without price movement, no trading profits can be generated; yet excessive or unexpected volatility without proper position sizing leads to rapid stop-outs and account liquidation. Understanding, measuring, and adapting to shifting volatility regimes is the hallmark of professional risk management.
Historical Volatility vs. Implied Volatility
In quantitative finance and currency trading, volatility is bifurcated into two distinct frameworks:
| Volatility Type | Nature | Calculation Source | Primary Trading Application |
|---|---|---|---|
| Historical Volatility (HV) | Backward-looking (realized) | Standard deviation of historical logarithmic daily price returns | Measuring past market behavior, setting baseline ATR stop-losses |
| Implied Volatility (IV) | Forward-looking (expected) | Derived from market pricing of OTC currency options contracts | Anticipating expected market turbulence around elections or rate decisions |
1. Historical (Realized) Volatility
Historical volatility calculates the annualized standard deviation ($\sigma$) of daily log price changes over a set lookback period (commonly 20, 30, or 90 days):
$$\sigma_{\text{annual}} = \sqrt{\frac{\sum_{t=1}^N (R_t - \bar{R})^2}{N - 1}} \times \sqrt{252}$$
Where $R_t$ represents daily returns and 252 represents the number of trading days in a standard year.
2. Implied Volatility
Implied volatility represents the market’s consensus expectation of future price turbulence over an option’s remaining life. If institutional investors anticipate extreme geopolitical risk or an emergency central bank rate change, option premiums surge, driving implied volatility higher even before spot prices begin to move.
Core Technical Tools for Measuring Forex Volatility
Currency traders quantify volatility on active price charts using three primary indicators:
- Average True Range (ATR): Developed by J. Welles Wilder Jr., ATR measures the average range between session highs, lows, and previous closes in raw pips. A 14-period daily ATR of 120 pips on GBP/USD indicates that the pair typically covers 120 pips of total distance in a single day.
- Bollinger Band Width: Measures the percentage distance between the upper and lower Bollinger Bands ($\pm 2\sigma$). When the bands pinch together tightly, volatility has compressed to cyclical lows, forecasting an imminent explosive breakout.
- Currency Volatility Indices: Institutional desks monitor benchmark indices such as the JPMorgan Global FX Volatility Index (JPMVXY) or Deutsche Bank Currency Volatility Index (CVIX) to gauge systemic risk sentiment.
Volatility Regimes: The Cycle of Compression and Expansion
Financial volatility is not constant; it clusters cyclically. In quantitative finance, this phenomenon is known as volatility clustering: periods of low volatility inevitably lead to periods of high volatility, and vice versa.
High Volatility Spike (Exhaustion / Blow-off)
             ▲                        │
             │                        ▼
     Volatility Expansion    Volatility Compression (The Squeeze)
             │                        ▲
             │                        │
└────────────────────────┘- Compression (Consolidation): The market coils inside narrow trading ranges (such as during the quiet Asian trading session). Bid-ask spreads tighten, and order books build up pending liquidity above and below the range.
- Expansion (Breakout): A fundamental catalyst breaks the consolidation. Stored liquidity is triggered, causing a rapid surge in directional volatility that carries prices to new support or resistance levels.
Volatility-Adjusted Position Sizing: A Concrete Example
The greatest danger in forex trading is treating all currency pairs as if they possess identical volatility. Trading 1.0 standard lot of EUR/CHF (a low-volatility pair) carries vastly different risk than trading 1.0 standard lot of GBP/JPY (a volatile cross):
- Account Capital: $20,000
- Risk Rule: Maximum 1% risk per trade ($200)
Scenario A: Low-Volatility Pair (EUR/CHF)
- Daily ATR: 40 pips
- Required Stop-Loss ($1.5 \times \text{ATR}$): 60 pips
- Allowable Trade Size: $$\text{Lot Size} = \frac{$200}{60 \text{ pips} \times $11.00/\text{pip}} \approx \mathbf{0.30 \text{ Lots}}$$
Scenario B: High-Volatility Pair (GBP/JPY)
- Daily ATR: 160 pips
- Required Stop-Loss ($1.5 \times \text{ATR}$): 240 pips
- Allowable Trade Size: $$\text{Lot Size} = \frac{$200}{240 \text{ pips} \times $6.70/\text{pip}} \approx \mathbf{0.12 \text{ Lots}}$$
By reducing position size by more than 60% on GBP/JPY, the trader normalizes volatility, ensuring their dollar risk remains identical ($200) regardless of the asset traded.
Key Takeaways
- Dispersion of Price: Volatility measures the magnitude and speed of price fluctuations over a given timeframe.
- HV vs. IV: Historical volatility measures past price variance; implied volatility reflects forward-looking option market expectations.
- Volatility Clustering: Low-volatility consolidations predictably precede violent, high-volatility trend expansions.
- Dynamic Risk Management: Professional traders adjust stop-loss buffers and position sizes using the Average True Range (ATR).
- Cross-Pair Diversity: Highly volatile pairs (like GBP/JPY) require significantly smaller lot sizes than stable pairs (like EUR/CHF) to maintain uniform account risk.
Frequently Asked Questions
Is high volatility good or bad for forex traders?
High volatility is neither inherently good nor bad. For prepared trend-followers and breakout traders with disciplined risk sizing, high volatility generates massive profit opportunities. For undercapitalized traders using excessive leverage, high volatility quickly triggers forced margin calls and liquidations.
Which currency pair is the most volatile in forex?
Exotic currency pairs (such as USD/ZAR, USD/TRY, and USD/MXN) and cross pairs involving the British pound and Japanese yen (such as GBP/JPY and GBP/AUD) consistently exhibit the highest daily pip ranges and volatility.
What is the “volatility squeeze”?
A volatility squeeze occurs when price consolidates into an abnormally tight range, causing Bollinger Bands or ATR to reach multi-month lows. Because volatility is mean-reverting, a squeeze is almost always followed by an explosive breakout in the direction of the dominant institutional flow.
Ready to trade forex?
Open a free demo account with a regulated broker. Practice with virtual funds before risking real money.