Rectangle
A rectangle is a classic technical analysis chart pattern characterized by horizontal parallel support and resistance trendlines bounding price action, signaling a temporary pause or consolidation before price breaks out in either a trend continuation or reversal.
What Is a Rectangle Chart Pattern?
In technical analysis and chart pattern classical theory, a rectangle (also known as a trading range, consolidation box, or Darvas Box) is a continuation or reversal pattern where the price of an asset is confined between two parallel, horizontal trendlines:
- The Upper Boundary (Resistance Ceiling): Connects at least two distinct swing highs where selling pressure repeatedly halts upward momentum.
- The Lower Boundary (Support Floor): Connects at least two distinct swing lows where buying demand repeatedly absorbs selling pressure.
During the formation of a rectangle, buyers and sellers are in temporary equilibrium. The pattern reflects a tug-of-war where neither the bulls nor the bears possess sufficient institutional volume to force a directional trend. Eventually, one side exhausts the counterparty’s liquidity, leading to a decisive breakout that often initiates an explosive trend continuation.
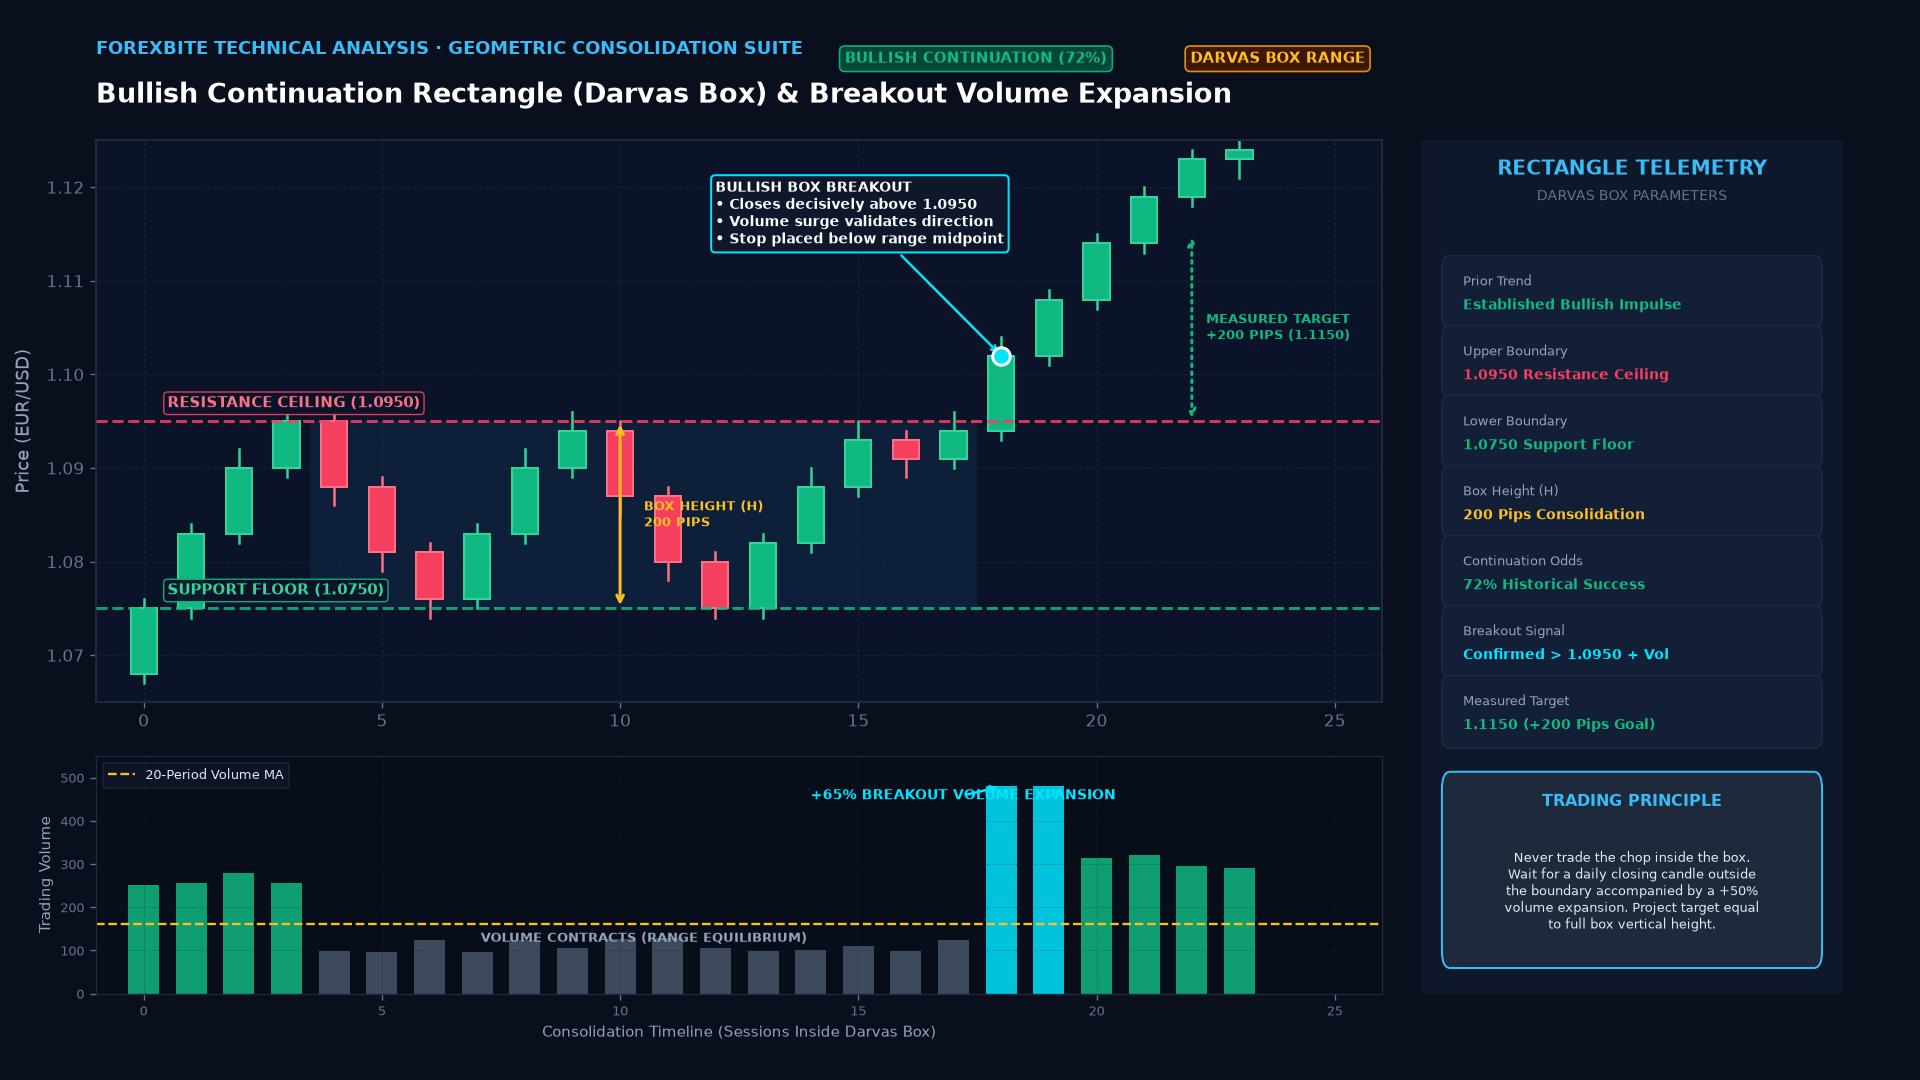
Technical Specifications: Continuation vs. Reversal Rectangles
While rectangles can form as either continuation or reversal patterns, institutional statistics demonstrate a strong bias toward trend continuation:
1. Bullish Continuation Rectangle
- Preceding Trend: Established upward bull trend.
- Pattern Dynamics: Price pauses to consolidate, printing horizontal highs and lows. Volume typically dries up as the pattern matures.
- Breakout Direction: Bullish breakout through the resistance ceiling on expanding volume.
- Statistical Frequency: Approximately 70% of rectangles in bull markets resolve as continuation breakouts.
2. Bearish Continuation Rectangle
- Preceding Trend: Established downward bear trend.
- Pattern Dynamics: Selling momentum pauses as shorts take profit and bargain-hunters buy the dip, creating a horizontal box.
- Breakout Direction: Downward breakdown through the support floor, triggering stop-losses of bottom-buyers.
3. Reversal Rectangle (Triple/Quadruple Tops and Bottoms)
If a rectangle forms after an extended, multi-year parabolic trend and breaks out in the opposite direction of the prior trend, it functions as a major distribution or accumulation reversal structure (e.g., a multi-month ceiling breaking downward).
Measuring Price Objectives: The Measured Move Formula
Rectangles provide traders with an objective, mathematically precise price projection known as the Measured Move:
$$\text{Rectangle Height } (H) = \text{Resistance Price} - \text{Support Price}$$
$$\text{Bullish Breakout Target} = \text{Resistance Price} + H$$
$$\text{Bearish Breakdown Target} = \text{Support Price} - H$$
       MEASURED MOVE CALCULATION ON A RECTANGLE

  Resistance Level: $1.2000 ============================+
                            ^                           |
                            | Pattern Height (H)        |
                            | = 200 Pips                |
  Support Level:    $1.1800 ============================|
                                                        |
  Breakout Occurs at $1.2000 --------------------------->
                                                        |
  Minimum Projected Target: $1.2000 + 200 Pips =======> $1.2200 Target
Trading Tactical Framework: Inside the Box vs. The Breakout
Traders deploy two primary strategies when interacting with a rectangle pattern:
| Strategy | Entry Condition | Stop-Loss Placement | Risk vs. Reward Profile |
|---|---|---|---|
| Trading the Range (Range Fading) | Buy at Support Floor or Sell at Resistance Ceiling with candlestick confirmation. | Placed just outside the box boundary (10–20 pips beyond). | High win rate in quiet consolidation; limited profit potential (capped at opposite boundary). |
| Trading the Breakout (Aggressive) | Buy the instant a candle closes outside the rectangle boundary on high volume. | Placed back inside the midpoint of the rectangle. | Lower win rate due to potential “false breakouts” (fakeouts); massive profit potential on true runners. |
| Trading the Retest (Conservative) | Wait for the breakout, then enter on a pullback that retests the broken boundary as support. | Placed just behind the retest swing rejection low. | Optimal Institutional Setup: Offers tightest stop-loss and highest risk-adjusted Sharpe ratio. |
Real-World Case Study: USD/CAD Rectangle Breakout
In early 2021, the Canadian Dollar and US Dollar entered a period of macroeconomic consolidation as oil prices stabilized near $60/barrel:
- The Rectangle Boundaries: Over 12 weeks, spot USD/CAD formed a clean, textbook rectangle on the Daily chart:
- Resistance Ceiling: 1.2620 (tested 4 times)
- Support Floor: 1.2460 (tested 3 times)
- Pattern Height ($H$): $1.2620 - 1.2460 = \mathbf{160 \ \text{pips}}$
- The Breakdown: On April 21, 2021, the Bank of Canada unexpectedly announced that it would begin tapering its bond-buying stimulus program. The Canadian Dollar surged.
- The Execution: USD/CAD broke below the 1.2460 support floor with an aggressive daily bearish Marubozu candle on massive interbank volume.
- Target Achievement: $$\text{Projected Target} = 1.2460 - 160 \ \text{pips} = \mathbf{1.2300}$$
- Outcome: The pair collapsed without pausing, reaching 1.2300 within six trading days and bottoming near 1.2050, delivering a textbook measured move.
Frequently Asked Questions
How many touches are required to validate a rectangle?
A valid rectangle requires at least four points of contact: two distinct swing highs touching the resistance ceiling, and two distinct swing lows touching the support floor. Patterns with three or more touches on each boundary are considered significantly stronger and more reliable.
What is a “False Breakout” (Fakeout) and how can it be avoided?
A false breakout occurs when price temporarily breaches a rectangle boundary (triggering stop-losses and enticing breakout traders), only to reverse sharply and close back inside the box. Traders filter fakeouts by waiting for a full candle body close outside the range on high volume, or requiring a secondary retest confirmation before entering.
What volume behavior is typical during a rectangle?
In classic technical analysis, volume steadily declines as the rectangle develops, reflecting waning trader interest and volatility compression. A valid breakout is almost always accompanied by a dramatic spike in volume, confirming institutional participation.
Ready to trade forex?
Open a free demo account with a regulated broker. Practice with virtual funds before risking real money.