Unit Cost
In managerial accounting and financial economics, unit cost is the total economic expenditure incurred by an enterprise to produce, store, and market a single unit of a product or service, calculated by dividing total expenses by aggregate output.
Unit Cost
In managerial economics, cost accounting, and equity valuation, unit cost (also termed average total cost, or ATC) represents the aggregate financial expenditure required to produce, store, and deliver one single unit of a good or service. Calculated by dividing total production and operational expenses by aggregate output volume, unit cost serves as the primary metric for setting baseline selling prices, evaluating manufacturing efficiency, and determining corporate gross profit margins.
For financial analysts and portfolio managers, the behavior of unit cost across fluctuating production volumes reveals an enterprise’s operating leverage, scalability, and long-term competitive moat. Companies capable of systematically reducing their unit costs below industry competitors achieve superior operating margins, sustainable pricing power, and resilient free cash flow across full macroeconomic business cycles.
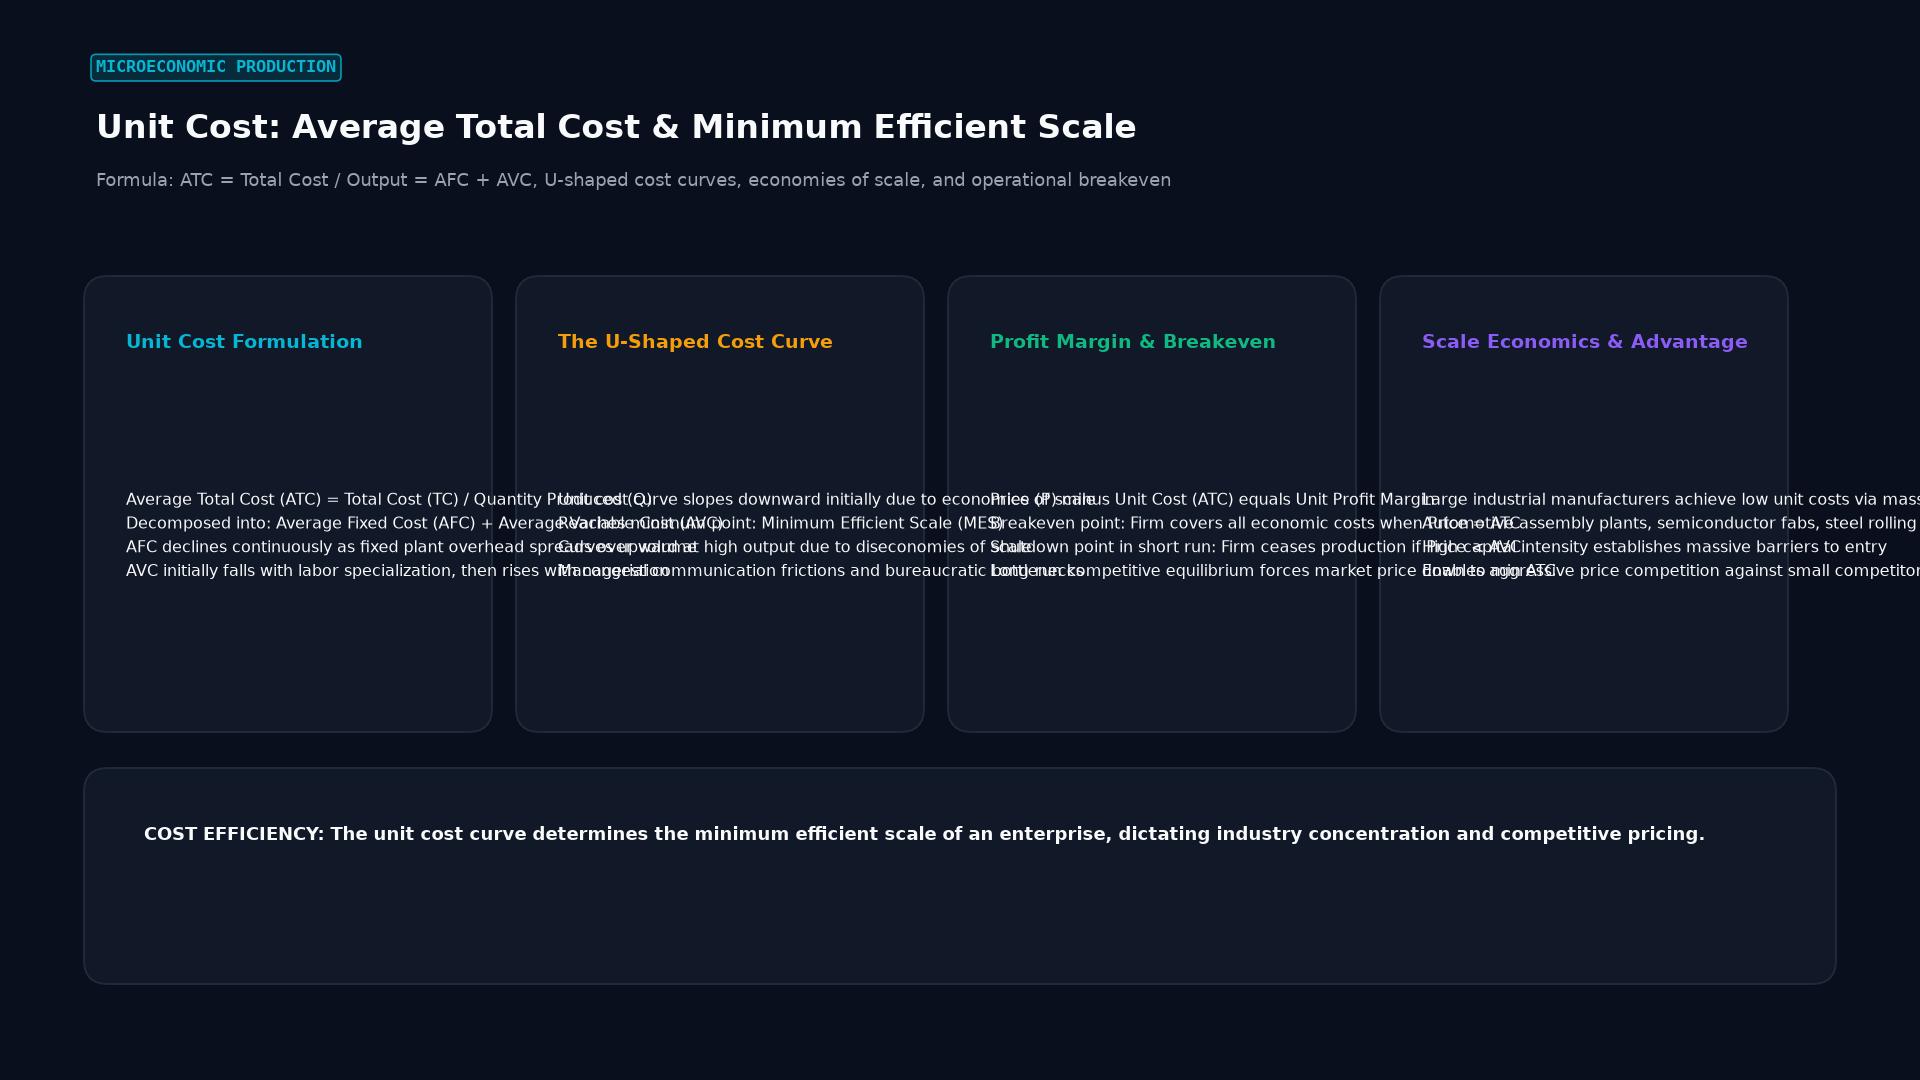 Figure: Formula: ATC = Total Cost / Output = AFC + AVC, U-shaped cost curves, economies of scale, and operational breakeven
Mathematical Formulation and Cost Behavior
To calculate and analyze unit cost, financial analysts decompose total operational expenditure into its fixed and variable components:
1. Fundamental Unit Cost Equation
$$\text{Unit Cost} (UC) = \frac{\text{Total Cost } (TC)}{Q} = \frac{\text{Total Fixed Cost } (TFC) + \text{Total Variable Cost } (TVC)}{Q}$$
This expression can be rewritten as the sum of average fixed cost and average variable cost: $$\text{Unit Cost} = \text{Average Fixed Cost } (AFC) + \text{Average Variable Cost } (AVC)$$ $$\text{Where: } AFC = \frac{TFC}{Q}, \quad AVC = \frac{TVC}{Q}$$
2. Behavioral Differences Across Volume
- Average Fixed Cost (AFC): Exhibits a hyperbolic downward trajectory as output expands. Because total fixed costs remain constant within a relevant capacity range, spreading them over an increasing volume ($Q$) causes $AFC$ to approach zero asymptotically. This phenomenon is known as fixed-cost dilution.
- Average Variable Cost (AVC): Remains relatively constant per unit at moderate production levels, but begins to rise once a facility approaches its physical capacity constraints due to overtime labor premiums, machine bottlenecks, and equipment wear.
- Marginal Cost (MC): The incremental cost incurred to manufacture one additional unit: $$MC = \frac{\Delta TC}{\Delta Q} = \frac{d(TC)}{dQ}$$ The marginal cost curve intersects both the $AVC$ and $ATC$ curves at their minimum points.
Cost ($)
  ^
  |        \                                 /  Marginal Cost (MC)
  |         \                               /
  |          \                             /
  |           \        ATC Curve          /
  |            \       .-'''''-.         /
  |             '--..-'         '-.._   /
  |                  \               '-'--.._
  |                   '--.._                 '--.._ AVC Curve
  |                         '---...___
  |                                   '---...___ AFC Curve
  +------------------------------------------------------------> Output (Q)
                                    ^
                           Minimum Efficient Scale (MES)
Economies of Scale vs. Diseconomies of Scale
The relationship between unit cost and long-run output volume defines the competitive structure of an industry:
1. Economies of Scale (Decreasing Unit Cost)
When increasing output leads to lower average total unit costs, the enterprise achieves economies of scale. Drivers include:
- Bulk Purchasing Discounts: Procuring raw materials and components in massive quantities lowers per-unit procurement costs.
- Specialization of Labor: High volumes allow workers and engineering teams to specialize in specific production steps, increasing throughput efficiency.
- Capital Indivisibilities: Expensive, high-throughput automated machinery (such as semiconductor photolithography scanners or automotive stamping presses) can only be economically justified if fixed costs are amortized over millions of units.
2. Minimum Efficient Scale (MES)
The Minimum Efficient Scale (MES) is the lowest output volume at which an enterprise minimizes its long-run unit cost. In capital-intensive industries (e.g., semiconductor fabrication, steel production, commercial aircraft manufacturing), the MES is exceptionally large relative to total market demand, creating massive barriers to entry that protect incumbent oligopolies.
3. Diseconomies of Scale (Increasing Unit Cost)
If an enterprise expands beyond its optimal operational envelope, unit costs begin to increase. Key drivers include:
- Bureaucratic Inefficiency: Communication delays, management bloat, and agency problems across sprawling corporate structures.
- Supply Chain Bottlenecks: Local shortages of raw materials forcing the firm to source from distant, expensive suppliers.
- Workforce Fatigue and Overtime: Excessive shift work and equipment strain leading to defect spikes and maintenance downtime.
Costing Methodologies: Absorption vs. Variable Costing
In financial reporting and managerial accounting, the classification of unit cost depends heavily on the accounting framework employed:
| Accounting Dimension | Full Absorption Costing (GAAP / IFRS) | Variable Costing (Managerial Direct Costing) |
|---|---|---|
| Direct Materials & Labor | Included in unit product cost | Included in unit product cost |
| Variable Manufacturing Overhead | Included in unit product cost | Included in unit product cost |
| Fixed Manufacturing Overhead | Included in unit product cost (allocated per unit) | Excluded (treated as period expense on income statement) |
| Selling, General & Admin (SG&A) | Excluded from product cost (period expense) | Excluded from product cost (period expense) |
| Inventory Impact | Deferral of fixed overhead into unsold inventory | Zero fixed overhead deferred; all expensed immediately |
| Strategic Use Case | Mandatory for external public audited reporting | Optimal for internal short-term pricing and production decisions |
The Absorption Costing Hazard
Under external GAAP/IFRS absorption costing, management can artificially inflate reported net operating income in the short term by overproducing inventory. Because fixed factory overhead is assigned to every manufactured unit, producing units that sit unsold in a warehouse traps fixed costs on the balance sheet inside “Finished Goods Inventory” rather than expensing them against current revenues on the income statement.
Financial analysts identify this distortion by calculating the ratio of inventory growth to sales growth: if finished goods inventory is expanding substantially faster than revenue, reported earnings may be cosmetically boosted by unabsorbed overhead rather than genuine commercial demand.
Applied Operational Case Study: Automotive Battery Cell Fabrication
To evaluate how unit cost dynamics govern corporate profitability, consider ElectraCell Energy, a manufacturer producing lithium-iron-phosphate (LFP) battery packs for commercial fleet vehicles.
Factory Cost Architecture
- Annual Factory Fixed Costs (TFC): $120,000,000 (amortization of cleanroom facilities, robotic assembly lines, facility rent, core engineering salaries).
- Direct Variable Cost per Battery Pack (VC): $4,000 (lithium salts, graphite anodes, copper foil, electrolyte, direct assembly labor, testing energy).
- Installed Factory Capacity: 50,000 battery packs per year.
Scenario Analysis Across Three Production Volumes
+------------------------------------------------------------------------+
|               ElectraCell Unit Cost Schedule by Volume                 |
+------------------------------------------------------------------------+
| Metric                 | Low Utilization    | Target Volume     | Max Capacity       |
| Annual Output (Q)      | 15,000 packs       | 30,000 packs      | 50,000 packs       |
| Total Fixed Costs (TFC)| $120,000,000       | $120,000,000      | $120,000,000       |
| Total Variable Costs   | $60,000,000        | $120,000,000      | $200,000,000       |
| Total Expenses (TC)    | $180,000,000       | $240,000,000      | $320,000,000       |
| Average Fixed Cost(AFC)| $8,000 / pack      | $4,000 / pack     | $2,400 / pack      |
| Average Variable (AVC) | $4,000 / pack      | $4,000 / pack     | $4,000 / pack      |
| Total Unit Cost (ATC)  | $12,000 / pack     | $8,000 / pack     | $6,400 / pack      |
+------------------------------------------------------------------------+
Strategic Implications
- Market Price Environment: Suppose commercial fleet buyers pay an industry standard price of $8,500 per battery pack.
- At 15,000 Packs: ElectraCell incurs a net loss of $3,500 per pack ($8,500 revenue minus $12,000 unit cost), resulting in an annual corporate net loss of $52,500,000.
- At 30,000 Packs: The unit cost drops to $8,000. ElectraCell turns profitable, generating $500 per pack, or $15,000,000 in net operating income.
- At 50,000 Packs: Fixed-cost dilution lowers unit cost to $6,400. Profit expands to $2,100 per pack, producing $105,000,000 in operating income.
This case demonstrates the power of operating leverage: a 66% increase in production from 30,000 to 50,000 packs drives a 600% surge in operating profit ($15M to $105M), directly resulting from unit cost reduction.
Frequently Asked Questions
What is the difference between unit cost and marginal cost?
Unit cost (average total cost) is the aggregate cost of all units produced divided by the total number of units, reflecting the historical average expenditure per item. Marginal cost is the specific incremental cost required to produce one additional unit of output. While unit cost includes allocated fixed costs, short-run marginal cost consists almost entirely of variable inputs (raw materials and direct labor).
How do changes in unit cost affect a company’s break-even point?
A reduction in variable unit cost increases the contribution margin per unit (Selling Price minus Variable Unit Cost). A higher contribution margin means each sold unit contributes more cash toward covering fixed overhead, lowering the total unit volume required to reach the corporate break-even point.
Why do equity analysts monitor unit cost trends during inflation?
During periods of general economic inflation, rising prices for raw commodities, logistics, and skilled labor increase variable unit costs. If an enterprise cannot pass these cost increases onto customers via higher selling prices, its gross profit margin contracts. Analysts track unit cost trends to differentiate between companies with genuine pricing power and those vulnerable to margin compression.
Ready to trade forex?
Open a free demo account with a regulated broker. Practice with virtual funds before risking real money.