Year-over-Year - YoY
A financial and macroeconomic performance metric that compares the financial or economic data of a specific period with the corresponding period of the previous year, effectively neutralizing seasonal distortions.
Year-over-Year (YoY)
In financial analysis, macroeconomic forecasting, and corporate equity research, Year-over-Year (commonly abbreviated as YoY, or less frequently Y/Y) is a foundational comparative metric that measures the percentage change in a financial, operational, or economic data point between a specific period (such as a month, quarter, or semester) and the mathematically identical time period in the immediately preceding calendar or fiscal year.
The primary methodological value of Year-over-Year analysis lies in its ability to eliminate seasonal volatility. Many consumer businesses, agricultural sectors, and energy markets exhibit severe recurring cyclicality (such as holiday shopping surges in retail, quarterly tax remittance cycles, or winter heating demand in natural gas). By comparing Fourth Quarter (Q4) performance against the previous year’s Q4, rather than comparing Q4 directly against Third Quarter (Q3), YoY calculations filter out regular seasonal patterns, providing institutional analysts and central bank policymakers with a clean assessment of underlying structural trends.
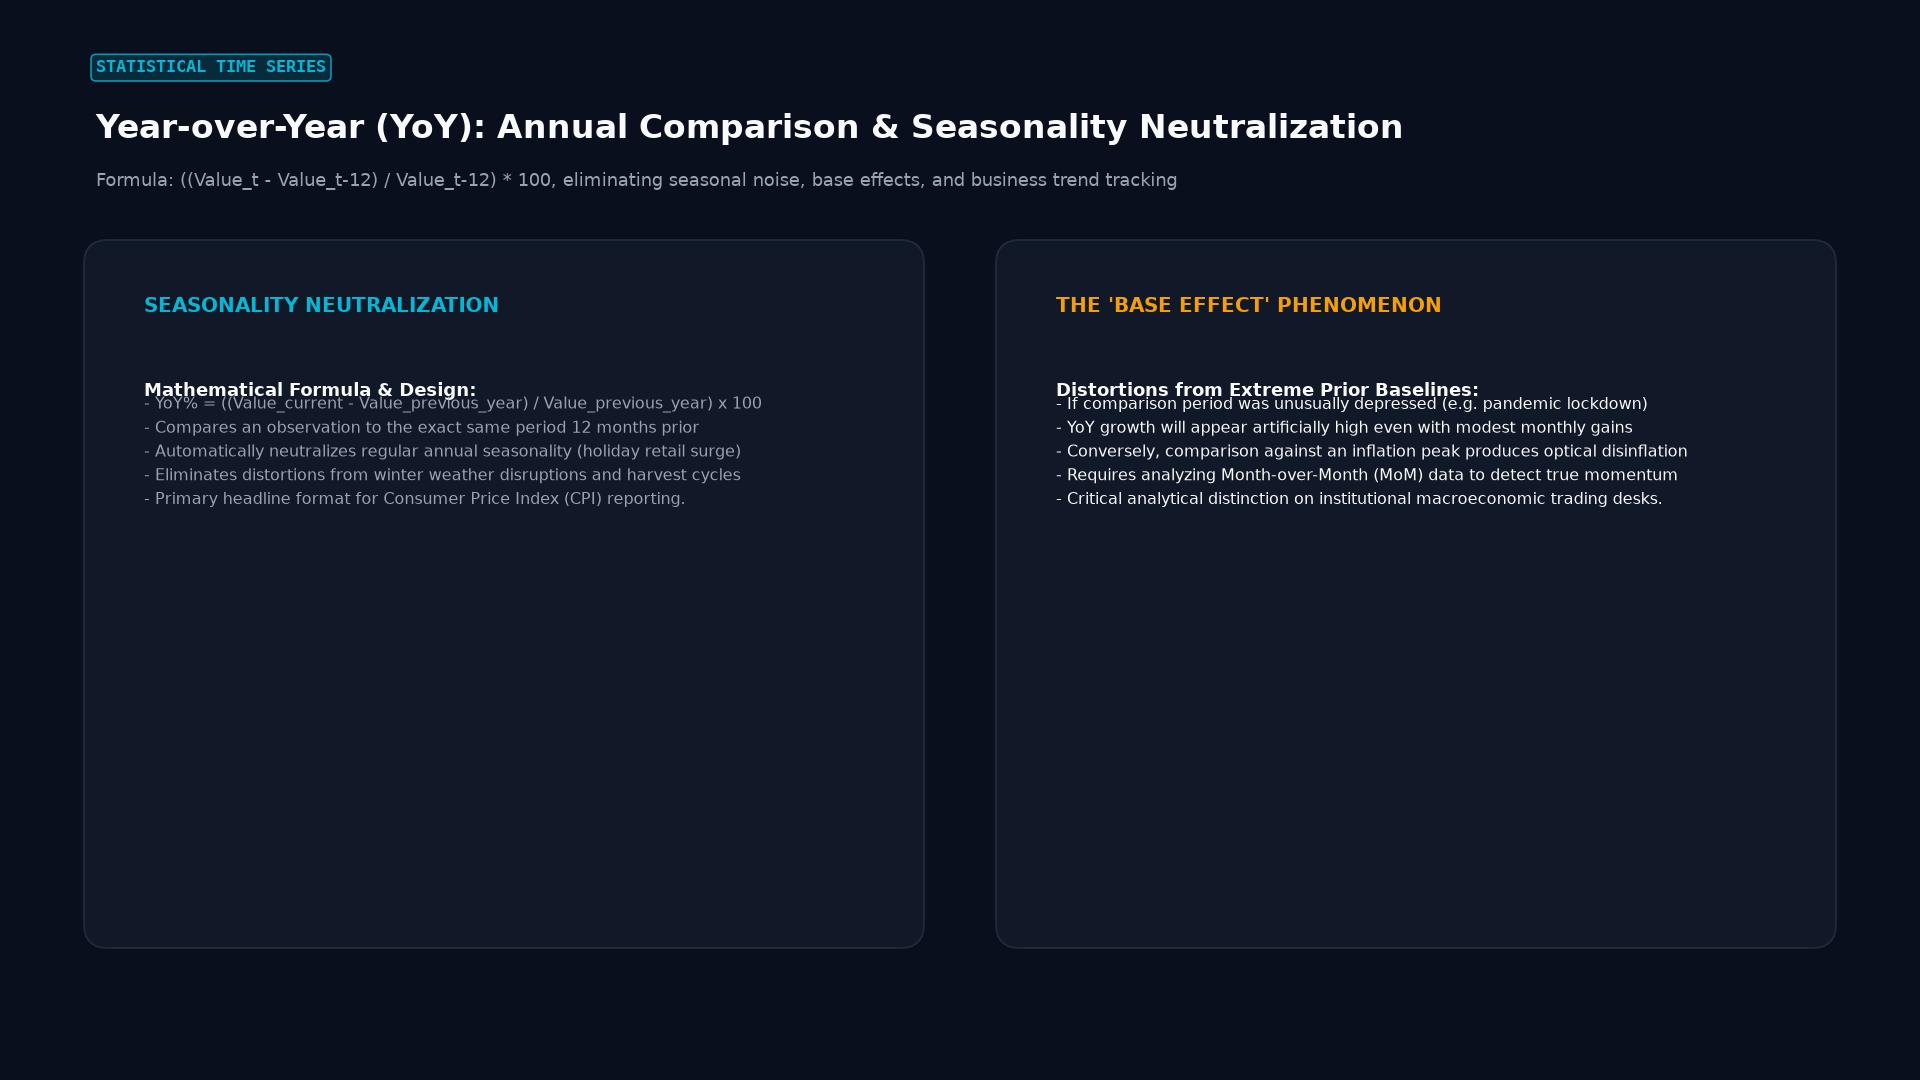 Figure: Formula: ((Value_t - Value_t-12) / Value_t-12) * 100, eliminating seasonal noise, base effects, and business trend tracking
Mathematical Formulation and Calculation
The mathematical derivation of Year-over-Year growth is straightforward, applicable across monthly, quarterly, or custom fiscal intervals:
1. The Standard YoY Percentage Change Formula
$$\text{YoY Percentage Change} = \left(\frac{\text{Value}t - \text{Value}{t-12}}{\text{Value}_{t-12}}\right) \times 100$$ $$\text{Or equivalently: } \text{YoY Percentage Change} = \left(\frac{\text{Value}t}{\text{Value}{t-12}} - 1\right) \times 100$$
Where:
- $\text{Value}_t$: The observed financial or economic value in the current period (e.g., December 2026, or Q3 2026).
- $\text{Value}_{t-12}$: The observed value in the exact corresponding period 12 months prior (e.g., December 2025, or Q3 2025).
2. Multi-Period Compound Annual Growth Rate (CAGR)
When analyzing Year-over-Year trends across multiple consecutive years (e.g., over a 3-year or 5-year investment horizon), equity analysts calculate the Compound Annual Growth Rate (CAGR) to determine the smoothed annualized YoY trajectory: $$\text{CAGR} = \left(\frac{\text{Ending Value}}{\text{Beginning Value}}\right)^{\frac{1}{n}} - 1$$ Where $n$ represents the total elapsed number of years in the evaluation window.
Primary Applications in Macroeconomics and Central Banking
Year-over-Year metrics serve as primary benchmark targets for monetary policy, sovereign debt markets, and foreign exchange trading desks:
1. Consumer Price Index (CPI) Headline and Core Inflation
Central banks (including the Federal Reserve, the European Central Bank, and the Bank of England) formally define their inflation targets in Year-over-Year terms:
- The Fed’s statutory target is 2.0% annual inflation measured Year-over-Year by the Personal Consumption Expenditures (PCE) price index.
- If headline CPI prints at 3.5% YoY, it indicates that the basket of consumer goods and services has increased by 3.5% over the preceding 12 months.
2. Real Gross Domestic Product (GDP) Expansion
While the United States Bureau of Economic Analysis (BEA) reports headline GDP as a Quarter-over-Quarter annualized rate (QoQ SAAR), most European, Asian, and emerging market statistical agencies (such as Eurostat and the National Bureau of Statistics of China) report economic growth strictly as a real Year-over-Year percentage change: $$\text{Real GDP YoY} = \left(\frac{\text{Real GDP}{Q4, 2026} - \text{Real GDP}{Q4, 2025}}{\text{Real GDP}_{Q4, 2025}}\right) \times 100$$
3. Corporate Earnings Seasons (EPS and Revenue Growth)
During quarterly corporate earnings releases on Wall Street, equity analysts focus on Year-over-Year growth rates in Revenue, EBITDA, and Diluted Earnings Per Share (EPS). A company reporting record quarterly revenue that represents a YoY contraction is often penalized by institutional investors because it signals decelerating corporate momentum.
+------------------------------------------------------------------------+
|          Comparison of Financial Performance Measurement Metrics       |
+------------------------------------------------------------------------+
| Metric Metric | Time Horizon Comparison | Primary Advantage     | Primary Limitation      |
| **YoY**       | Same period 1 yr ago    | Eliminates seasonality| Subject to base effects |
| **QoQ**       | Preceding sequential Q  | Spots recent momentum | Distorted by seasonality|
| **MoM**       | Preceding sequential M  | Immediate data signal | High noise / volatility |
| **YTD**       | Jan 1 to current date   | Fiscal progress check | Varies in length by month|
+------------------------------------------------------------------------+
The “Base Effect” Anomaly: Interpreting Distortions in YoY Data
While Year-over-Year metrics neutralize seasonal patterns, they introduce a distinct analytical distortion known as the base effect:
What is the Base Effect?
The base effect occurs when an unusually high or abnormally low data point in the prior-year comparison period ($\text{Value}_{t-12}$) creates an optical distortion in the current Year-over-Year percentage print, regardless of current economic reality:
- Low Base Effect (Cosmetic Surge): If an economy or company experienced an acute collapse 12 months prior (e.g., nationwide COVID-19 lockdowns in April 2020 shutting down airline travel), the comparison base is artificially depressed. In April 2021, when normal operations resume, the reported YoY revenue growth may register at +300%, even though business activity has merely returned to normal pre-crisis levels.
- High Base Effect (Cosmetic Slump): Conversely, if an oil company benefited from an extreme, temporary crude oil spike to $130 per barrel in June 2022 following the outbreak of geopolitical conflict, its revenue base is elevated. In June 2023, with oil normalizing to $75 per barrel, the company prints a severe -42% YoY revenue contraction, even though the underlying enterprise remains profitable.
       Visualizing Base Effect Distortion:

       Year 1 (Depressed Crisis Level):       $50M
       Year 2 (Normal Baseline Output):       $100M  --> Prints as +100% YoY (Low Base Illusion)
       Year 3 (Modest Healthy Growth):        $105M  --> Prints as +5.0% YoY (High Base Deceleration)
To prevent misinterpreting base effects, sophisticated macro analysts and quantitative traders evaluate two-year stacked YoY growth rates or compare sequential seasonally adjusted monthly changes (MoM).
Applied Analytical Case Study: Retail E-Commerce Revenue Audit
To examine how YoY analysis uncovers true operational performance beneath seasonal surges, consider OmniRetail Brands (ORB), a multi-channel consumer retail corporation.
Reported Quarterly Financial Data (2025 vs. 2026)
- Q3 2025: $80,000,000
- Q4 2025 (Holiday Season): $150,000,000
- Q1 2026: $85,000,000
- Q2 2026: $90,000,000
- Q3 2026: $92,000,000
- Q4 2026 (Holiday Season): $165,000,000
Sequential (QoQ) vs. Annualized (YoY) Analysis
- The Flawed Sequential Interpretation (Q4 to Q1):
- Comparing Q1 2026 ($85M) to Q4 2025 ($150M) shows a sequential drop of -43.3%.
- An inexperienced observer might panic, assuming the business is collapsing. In reality, retail sales always decline from December holiday peaks into post-holiday January/February doldrums.
- The Accurate Year-over-Year Interpretation:
- Q1 YoY Growth: $$\text{Q1 YoY} = \left(\frac{$85\text{M} - $75\text{M}}{$75\text{M}}\right) \times 100 = +13.3%$$
- Q3 YoY Growth: $$\text{Q3 YoY} = \left(\frac{$92\text{M} - $80\text{M}}{$80\text{M}}\right) \times 100 = +15.0%$$
- Q4 YoY Growth: $$\text{Q4 YoY} = \left(\frac{$165\text{M} - $150\text{M}}{$150\text{M}}\right) \times 100 = +10.0%$$
+------------------------------------------------------------------------+
|               OmniRetail Performance Diagnostic Table                  |
+------------------------------------------------------------------------+
| Metric                 | Sequential Quarter (QoQ)| Year-over-Year (YoY)|
| Q4 2026 Growth Print   | +79.3% (vs Q3 2026)     | +10.0% (vs Q4 2025) |
| Analytical Insight     | Captures Holiday Season | Isolates Structural |
|                        | Inventory Flush         | Enterprise Growth   |
+------------------------------------------------------------------------+
The YoY analysis reveals that OmniRetail grew its core customer base by a healthy 10.0% to 15.0% across all four quarters of 2026, filtering out seasonal distortions that would otherwise cloud managerial decision-making.
Frequently Asked Questions
Why do financial analysts prefer YoY metrics over Quarter-over-Quarter (QoQ) metrics?
Analysts prefer YoY metrics because they neutralize seasonal factors that naturally distort sequential quarters. For instance, agricultural producers always generate peak revenues during autumn harvests, toy manufacturers generate disproportionate sales in the fourth-quarter holiday season, and utility providers experience peak electricity consumption during mid-summer air conditioning months. YoY compares like periods against like periods, isolating genuine structural growth from calendar cycles.
When can relying exclusively on YoY data be misleading?
YoY data can be misleading during rapid economic turning points or regime shifts. Because YoY metrics reflect cumulative changes over the preceding 12 months, they lag real-time economic developments. If an economy enters a severe recession in the current month, a YoY metric might still print positive for several consecutive months due to strong economic performance recorded 10 months prior, concealing the immediate downturn. In such scenarios, analysts supplement YoY with seasonally adjusted sequential Month-over-Month (MoM) data.
How does Year-to-Date (YTD) differ from Year-over-Year (YoY)?
Year-to-Date (YTD) measures the cumulative performance from the first day of the current calendar or fiscal year (typically January 1) up to the present date. Year-over-Year (YoY) measures the percentage change between a specific discrete time interval (such as the month of July or the third quarter) and the identical period in the prior year. YTD evaluates progress toward annual corporate targets, whereas YoY tracks annualized growth velocity.
Ready to trade forex?
Open a free demo account with a regulated broker. Practice with virtual funds before risking real money.