How to Keep a Forex Trading Journal: The System That Closes the Gap
A trading journal is the most underused tool in retail forex. Learn what to record, how to structure daily and weekly reviews, and how to extract patterns that improve your win rate over time.
Every professional trader keeps records. Not because they enjoy paperwork, but because trading without records is like running a business without accounting — you can’t tell whether you’re actually profitable, where your losses come from, or which decisions are costing you money.
A trading journal is the record of every trade you place: the setup, the entry, the exit, the result, and — critically — your decision-making process. It’s the data source for every meaningful review of your trading performance.
Without it, you’ll repeat the same mistakes indefinitely because you’ll never identify them clearly enough to address them.
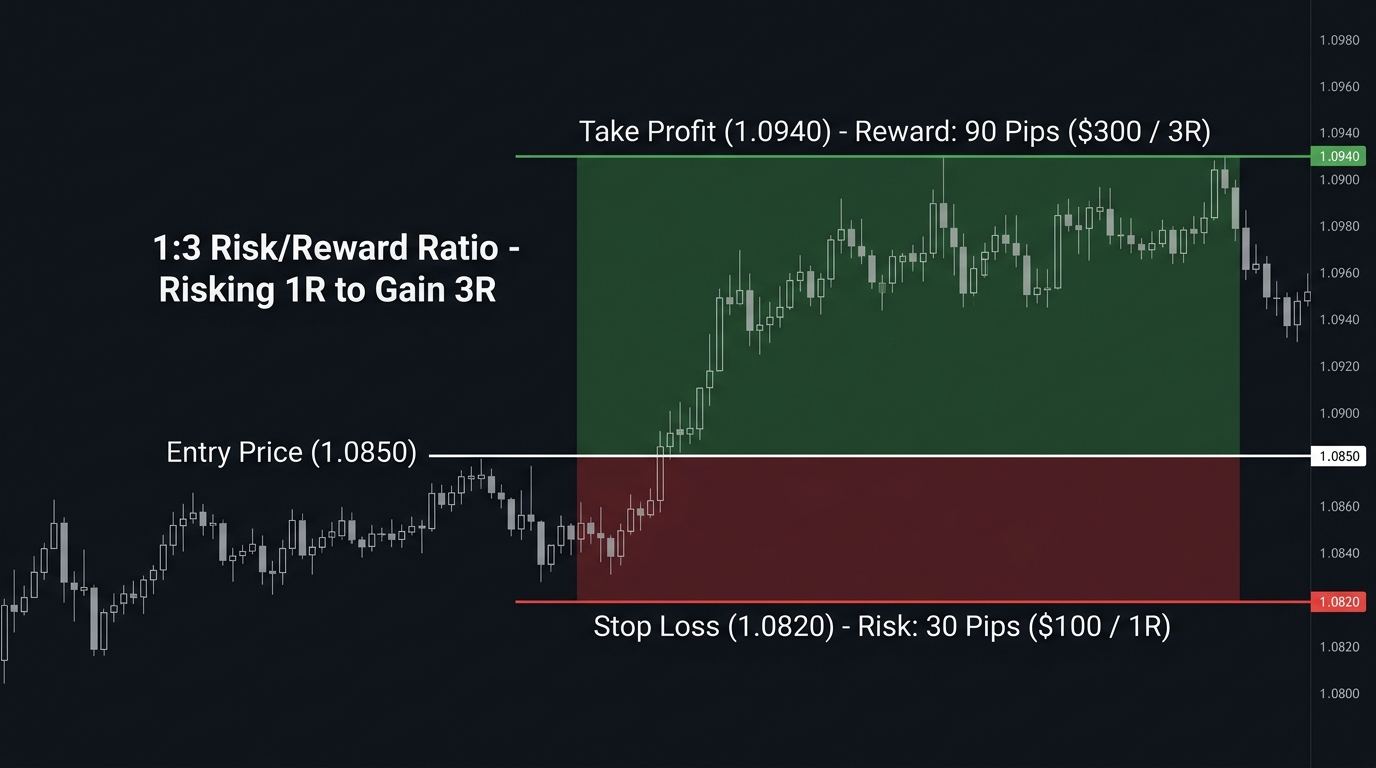
What to Record in Every Trade
A complete journal entry doesn’t require hours. For each trade, record:
Trade data (the facts):
- Date and time of entry
- Currency pair
- Direction (long / short)
- Entry price
- Stop-loss price (in pips)
- Take-profit price (in pips)
- Position size (lots)
- Risk amount (in account currency)
- Expected risk-reward ratio
Trade outcome (what happened):
- Exit price
- Result (win / loss / breakeven)
- Actual profit or loss (pips and currency)
- Did you follow the plan? (Yes / No)
- If No: what did you change and why?
Setup context (for pattern analysis):
- Timeframe traded
- Market condition at entry (trending / ranging / volatile)
- Strategy / setup name used
- Quality rating of the setup (1–5 scale)
- Screenshot of the chart at entry
Psychology (the most overlooked section):
- Emotional state at entry (calm / anxious / FOMO / revenge trade / overconfident)
- Any hesitation or second-guessing before entry?
- Any rule violations? Which ones?
Why the Psychology Section Matters Most
Most traders skip the psychology section. That’s the equivalent of a pilot’s black box that only records altitude but not what the crew was doing.
The psychology data is where the most actionable insights live. After 50–100 trades, patterns emerge:
- “My win rate on setups I rated 4–5 quality is 62%. On setups I rated 2–3, it’s 31%. I should only take high-quality setups.”
- “I have 8 trades tagged ‘FOMO entry’ — all 8 are losers. The feeling of fear of missing out is a stop signal, not an entry signal.”
- “My average loss on trades where I violated the stop-loss is 3.2x my average normal loss.”
You cannot see these patterns by memory. You need the data.
Journal Structure: Daily Template
Pre-session (before opening charts):
Date: [Date]
Market conditions today: [General notes — trending, news scheduled, volatile]
My mental state: [1-5 scale, one-line description]
Today's plan: [Max trades, specific pairs to watch, levels to monitor]
Today's max loss limit: [Amount — stop trading if hit]
Per-trade entry:
Trade #1
Pair: EUR/USD
Direction: Long
Entry: 1.0845
Stop-loss: 1.0810 (35 pips)
Take-profit: 1.0915 (70 pips, 1:2 RR)
Lots: 0.14 (1% risk = $70)
Setup: 4H support bounce + bullish engulfing
Setup quality: 4/5
Entry emotional state: Calm
Plan deviation: None
Per-trade outcome:
Exit: 1.0912
Result: +67 pips / +$93.80
Plan followed: Yes
Notes: Price moved directly to target. Strong momentum after London open.
Post-session (after closing):
Session P&L: +$93.80
Trades taken: 1
Followed plan: Yes
Biggest lesson: [One specific observation about today's trading]
Emotional state rating: 4/5
Weekly Review: Where the Real Learning Happens
The daily journal is raw material. The weekly review is where you extract value from it.
Weekly review template (every Sunday or Monday before the week begins):
Statistical review:
- Total trades this week: ___
- Win rate: ___%
- Average win (pips): ___
- Average loss (pips): ___
- Average RR achieved: ___
- Net P&L: ___
Pattern analysis:
- Which setups produced the best results this week?
- Which setups underperformed?
- Were there specific market conditions (ranging/trending) where the system struggled?
- Did any emotional states correlate with worse performance?
- Were there rule violations? What triggered them?
Decision for next week:
- Continue exactly as planned (if everything is working)?
- One specific adjustment based on this week’s data?
- Any pairs or timeframes to temporarily avoid?
The rule: Change only one thing at a time when adjusting. Multiple simultaneous changes make it impossible to identify which one caused improvement or deterioration.
Monthly Review: The Bigger Picture
Once a month, zoom out:
| Metric | This Month | Last Month | Trend |
|---|---|---|---|
| Win rate | ___% | ___% | ↑/↓/→ |
| Average RR | ___ | ___ | ↑/↓/→ |
| Net P&L | ___ | ___ | ↑/↓/→ |
| Rule violations | ___ | ___ | ↑/↓/→ |
| Best setup type | ___ | ___ | |
| Worst setup type | ___ | ___ |
This monthly comparison tells you whether your trading is improving over time — the only metric that actually matters for long-term development.
Tools for Keeping a Journal
Spreadsheet (Excel / Google Sheets): The most flexible option. Create columns for all the fields above. Add charts to track equity curve, win rate over time, performance by setup type. Free and fully customizable.
Dedicated journal software: Tools like Tradervue, Edgewonk, or TraderSync import trade data directly from MT4/MT5, automate statistics, and provide visual dashboards. Paid services ($20–$50/month) but significantly reduce manual work.
Notebook (physical): Surprising number of experienced traders swear by handwritten journals for the psychological section. The act of writing by hand forces slower, more deliberate reflection.
Use whatever you’ll actually maintain consistently. A simple spreadsheet maintained every day beats elaborate software used sporadically.
Journal Red Flags: What to Watch For
When reviewing your journal, these patterns demand immediate attention:
| Red Flag | What It Means |
|---|---|
| Average loss > average win | Your RR is negative; adjust take-profits or stop-losses |
| Win rate drops significantly on certain days | Check if you’re trading during low-liquidity or high-news periods |
| Multiple consecutive rule violations | Psychological state affecting execution; reduce size or take a break |
| Win rate drops after profitable sessions | Overconfidence pattern; size increase follows winning streak |
| High win rate but flat or negative P&L | Cutting winners too early; early TP is costing money |
| Losses concentrated in specific market conditions | System doesn’t work in that condition; add it to your filters |
Key Takeaways
- A trading journal records every trade’s facts, outcome, setup context, and psychological state — without it, you cannot identify patterns in your losses
- The psychology section is the most valuable and most skipped — emotional state at entry, rule deviations, and FOMO entries are the most common loss pattern sources
- Daily entry takes 5–10 minutes per trade; don’t skip entries to “catch up later”
- Weekly reviews extract patterns from the raw data: which setups work, which conditions hurt performance, which emotional states correlate with bad decisions
- Monthly reviews track development over time — the only way to know if you’re actually improving
- Change one variable at a time when adjusting your system based on journal data
- The tool doesn’t matter (spreadsheet, software, notebook) — consistency matters
Next: Testing Your Trading System | Forex Trading Plan
Related lesson: Trader Psychology

Ready to Practice This Strategy?
Test what you learned on a free, risk-free demo account before risking real money.