Risk-Reward Ratio: Why the Math of Trading Matters More Than Win Rate
The risk-reward ratio determines the minimum win rate you need to be profitable. Learn how to calculate it, set realistic targets, and why a trader with a 40% win rate can still beat one with 70%.
Most traders measure themselves by their win rate. “I win 65% of my trades” is treated as a badge of honor. But a trader winning 65% of trades can still lose money — consistently — depending on the size of those wins and losses.
The risk-reward ratio is the relationship between the amount you risk on a trade and the amount you stand to gain. It’s the number that determines whether your trading strategy is mathematically viable, regardless of your win rate.
What Is the Risk-Reward Ratio?
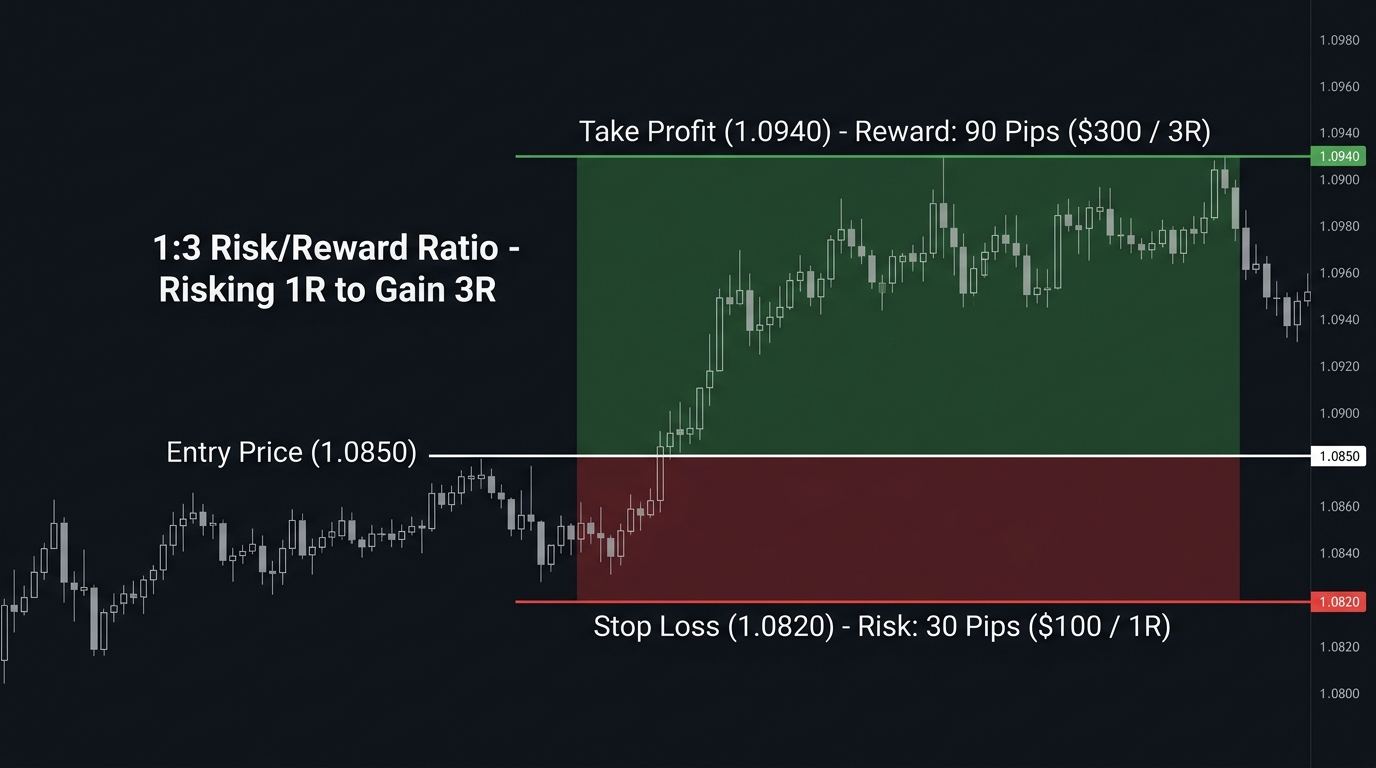
The risk-reward ratio compares the potential loss of a trade (if the stop-loss is hit) to the potential gain (if the take-profit is reached).
Formula:
Risk-Reward Ratio = Potential Loss / Potential Gain

Example: Stop-loss is 30 pips, Take-profit is 90 pips
RR = 30 / 90 = 1:3
A 1:3 ratio means you risk $1 to potentially earn $3. A 1:1 ratio means equal risk and reward. A 2:1 ratio means you risk $2 to earn $1 — this is generally unfavorable.
The convention is written as Risk : Reward (1:3 means risk 1, gain 3). Some traders invert this to Reward:Risk (3:1 means gain 3, risk 1). Be consistent and make sure you know which notation your broker or platform is using.
Why Win Rate Alone Is Meaningless
Here is the table that changes how traders think about their performance:
| Win Rate | Risk-Reward Ratio | Net Result After 100 Trades (1% risk/trade) |
|---|---|---|
| 70% | 1:0.5 | Loss (-10% account) |
| 60% | 1:1 | Profit (+20% account) |
| 50% | 1:2 | Profit (+50% account) |
| 40% | 1:3 | Profit (+60% account) |
| 35% | 1:4 | Profit (+75% account) |
| 25% | 1:5 | Breakeven |
A trader winning 70% of their trades but taking 2:1 adverse RR (risking $200 to gain $100) loses money over time. A trader winning only 40% of their trades at 1:3 RR makes significant profits.
This is not theoretical. It’s the mathematical structure of trading profitability. Understanding this changes what you look for in a strategy.
The Breakeven Win Rate Formula
For any given risk-reward ratio, there is a minimum win rate below which the strategy loses money regardless of everything else:
Minimum Win Rate = 1 / (1 + RR)

For 1:2 RR: 1 / (1+2) = 33.3%
For 1:3 RR: 1 / (1+3) = 25%
For 1:1 RR: 1 / (1+1) = 50%
Complete breakeven win rate table:
| Risk-Reward Ratio | Breakeven Win Rate |
|---|---|
| 1:0.5 | 66.7% |
| 1:1 | 50.0% |
| 1:1.5 | 40.0% |
| 1:2 | 33.3% |
| 1:2.5 | 28.6% |
| 1:3 | 25.0% |
| 1:4 | 20.0% |
| 1:5 | 16.7% |
The minimum professional standard for most trend-following strategies is 1:2 RR — meaning your win rate only needs to exceed 33% to generate a positive expectancy.
Setting Take-Profit Targets That Make Sense
The most common mistake when setting take-profits is choosing the target first, then working backward. The target must come from the chart — from the next significant support or resistance level — not from a desired dollar amount.
How to identify a realistic target:
- Enter based on a valid signal (breakout, bounce, reversal)
- Identify the next significant support/resistance level in the trade’s direction
- Calculate the distance from entry to that level — this is the take-profit
- Calculate the stop-loss distance based on your invalidation level (where the setup is wrong)
- Calculate the RR ratio
- If RR is below 1:1.5, the trade may not be worth taking
The filter question: Before entering any trade, ask: “If this trade goes perfectly, what is the first realistic obstacle for price?” If that obstacle is 30 pips away and your stop is 50 pips, your RR is 0.6:1 — a negative expectancy trade.
Trailing Stop-Losses and Dynamic Reward
One technique to improve the effective RR of winning trades is the trailing stop: moving the stop-loss in the direction of the trade as price moves in your favor. This locks in profits while allowing the position to run further.
For example:
- Enter long at 1.0800, stop at 1.0760, initial target at 1.0900 (1:2.5 RR)
- Price reaches 1.0850: move stop to 1.0800 (breakeven)
- Price reaches 1.0880: move stop to 1.0840
- Price reaches 1.0920 before reversing and stopping at 1.0880 (exit)
The original 1:2.5 RR became effectively 1:3 because the trailing stop extended the captured gain. Trailing stops work best in strongly trending, low-noise environments.
Why Most Retail Traders Have Inverted RR
Research consistently shows that retail traders tend to:
- Cut winning trades early (small wins)
- Hold losing trades too long (large losses)
This produces an average RR of less than 1:1 — a mathematically losing structure — even when win rates are decent. A 60% win rate with 0.8:1 average RR still produces a net loss.
The psychological forces driving this are well-documented:
- Loss aversion: The pain of a loss is roughly 2x the pleasure of an equivalent gain, causing traders to resist closing losing trades
- Profit taking anxiety: The fear that an unrealized profit will disappear causes premature exits
The solution is mechanical: set your take-profit and stop-loss at trade entry and do not adjust them based on emotional reactions to price movement. Your future self, who will be watching the candles move, cannot be trusted to follow the plan. Your current self, who is calm and analytical, sets the rules.
Combining RR With Win Rate: The Expected Value Calculation
Expected Value (EV) gives you the mathematical expectation per trade, in terms of risk units:
EV = (Win Rate × Reward) - (Loss Rate × Risk)

Example: 45% win rate, 1:2.5 RR
EV = (0.45 × 2.5) - (0.55 × 1) = 1.125 - 0.55 = +0.575

This means: for every unit of risk, you mathematically expect to gain 0.575 units over time.
A positive EV means a profitable strategy. Calculate this for your own system using your actual historical win rate and your average RR.
| Win Rate | RR | EV (per risk unit) | Profitable? |
|---|---|---|---|
| 60% | 1:1 | +0.20 | Yes |
| 50% | 1:2 | +0.50 | Yes |
| 40% | 1:3 | +0.80 | Yes |
| 40% | 1:1 | -0.20 | No |
| 55% | 0.8:1 | -0.04 | No |
Risk-Reward in Practice: Setting Up the Trade
- Identify the trade: Valid entry signal at a key level
- Set stop-loss first: Where exactly is the trade wrong? (Below support, above resistance, beyond a structure point)
- Calculate stop distance: In pips
- Identify take-profit level: First significant S/R in the trade’s direction
- Calculate RR: Target distance / stop distance
- Apply the filter: If RR < 1:1.5, skip the trade
- Size the position: Use position size calculator based on your account and stop distance
Key Takeaways
- Win rate alone means nothing without knowing the risk-reward ratio — a 70% win rate can still lose money with the wrong RR
- The breakeven win rate for a 1:2 RR strategy is just 33.3%; for 1:3, only 25%
- Set a minimum acceptable RR of 1:1.5 as a trade filter; professional traders typically use 1:2 or better
- Take-profit levels must come from chart structure (the next S/R level), not from desired dollar amounts
- Expected value = (win rate × reward) minus (loss rate × risk) — use this formula to validate whether your system has a genuine edge
- Most retail traders have inverted RR due to early profit-taking and late loss-cutting; mechanical stop/limit orders at entry solve this
- Calculate your system’s EV regularly using your trading journal data
Next: Stop-Loss Methods: Chart, Equity, and Volatility Stops

Ready to Practice This Strategy?
Test what you learned on a free, risk-free demo account before risking real money.