What Is a Drawdown in Forex? How to Measure, Manage, and Recover
A drawdown is the peak-to-trough decline in your trading account. Learn how to calculate it, set limits that protect your capital, understand recovery math, and avoid the psychology traps that turn small drawdowns into account wipeouts.
At some point in every trader’s career, the account goes into a losing stretch. The question is not whether it will happen. It’s how deep it goes and whether you come back from it.
A drawdown is the measurement of that decline. Understanding it precisely — how it’s calculated, what levels are normal vs. alarming, and the brutal mathematics of recovery — is essential knowledge for anyone managing a trading account seriously.
What Is a Drawdown?
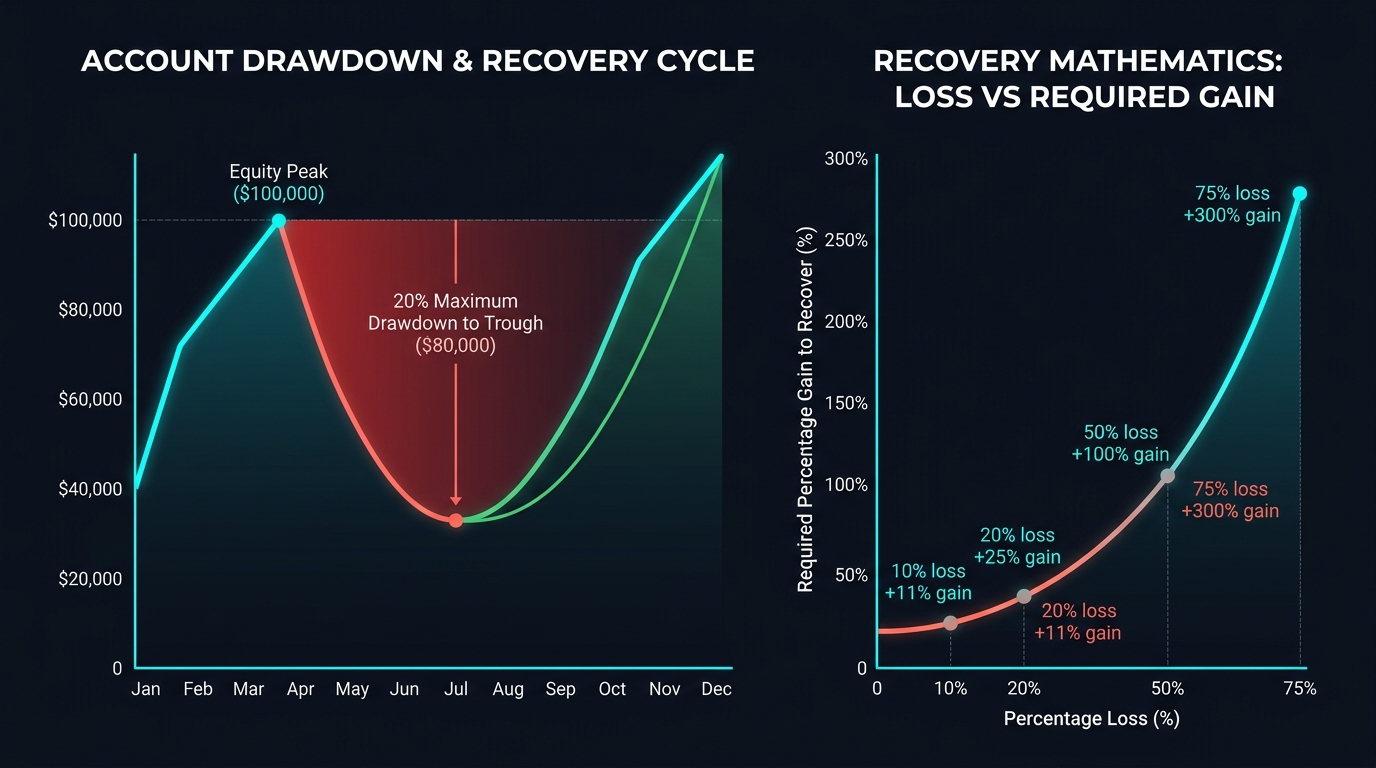
A drawdown is the peak-to-trough decline in account equity expressed as a percentage. If your account reaches $12,000 before declining to $9,600, you have experienced a 20% drawdown.
The formula:
Drawdown % = ((Peak Value - Trough Value) / Peak Value) × 100

Example: ($12,000 - $9,600) / $12,000 × 100 = 20% drawdown
Drawdowns are measured from the highest point the account has reached (the peak) — not from the initial deposit. If you started with $10,000, grew to $12,000, then declined to $9,600, the drawdown is 20% (measured from $12,000), even though the account is still above the starting deposit.
Types of Drawdown
| Type | Description | What It Tells You |
|---|---|---|
| Absolute drawdown | Decline from initial deposit | How close you are to losing your original capital |
| Maximum drawdown | Largest historical peak-to-trough decline | The worst period the system has experienced |
| Relative drawdown | Current decline from most recent equity peak | Your current risk of ruin relative to where you’ve been |
| Trade drawdown | Intraday decline within a single open position | How much unrealized loss you tolerate before exiting |
Professional traders track all four. The most closely watched in live trading is relative drawdown — because that’s what determines whether you’re still operating within normal parameters or have entered danger territory.
The Recovery Mathematics: Why Drawdowns Compound
This is the part most traders don’t know, and it’s critical:
Recovering from a drawdown requires a larger percentage gain than the drawdown itself. A 10% loss requires an 11.1% gain to recover. But a 50% loss requires a 100% gain.
| Drawdown | Gain Required to Break Even |
|---|---|
| 5% | 5.3% |
| 10% | 11.1% |
| 20% | 25.0% |
| 30% | 42.9% |
| 40% | 66.7% |
| 50% | 100.0% |
| 60% | 150.0% |
| 75% | 300.0% |
This asymmetry explains why capital preservation is more important than profit maximization in the early stages. A trader who avoids a 50% drawdown doesn’t need to double the account just to get back to where they started.
What Is an Acceptable Drawdown?
Drawdown tolerance varies by strategy type, but here are the benchmarks used in professional and institutional contexts:
| Context | Acceptable Maximum Drawdown |
|---|---|
| Retail retail account (beginner) | 5–10% before stopping to reassess |
| Retail account (experienced) | 10–20% |
| Hedge fund (typical) | 15–25% maximum; many close at 20% |
| Prop firm challenge (common rules) | 5–10% daily, 8–12% total |
| High-frequency strategies | <5% |
Most professional traders operate with a personal maximum drawdown of 15–20%. If the account hits that level, they stop trading for a defined period, conduct a formal review of their system, and only return when they understand what went wrong.
Why Drawdowns Happen
Understanding the cause of a drawdown determines the correct response:
Normal statistical variance: Even a winning strategy will have losing streaks. A system with a 55% win rate can produce 10+ consecutive losses by chance. This is expected behavior, not a system failure.
Changing market conditions: A trend-following strategy will struggle in ranging markets. A carry trade will suffer in risk-off environments. The system hasn’t failed — the market regime has shifted.
Strategy failure: The edge the system was built on has been arbitraged away or is no longer valid in the current market.
Execution or discipline failure: Trading the right system with poor discipline (skipping stops, oversizing, revenge trading) creates drawdowns unrelated to the system itself.
The response depends entirely on which cause applies. Normal variance requires patience. Regime change requires adaptation. System failure requires rebuilding. Discipline failure requires an honest audit of every rule violation.
Setting Drawdown Limits Before You Need Them
The most important rule about drawdown limits: they must be set when you are calm and rational, not after you’re already in the hole.
Write these three limits into your trading plan before you open your first live trade:
Daily drawdown limit: The maximum you will lose in a single day before stopping all trading for that day. Suggested range: 2–5% of account.
Weekly drawdown limit: The maximum weekly decline before you take two trading days off to reassess. Suggested range: 5–8% of account.
Maximum drawdown limit: The total peak-to-trough decline that triggers a full system review and temporary trading halt. Suggested range: 10–15% for beginners; 15–20% for experienced traders.
When any limit is hit, the correct response is the same: stop trading immediately for the defined period. Not “one more trade to try to recover.” Stop.
This feels emotionally impossible when you’re in it. That’s exactly why you set the rule when you’re not in it.
The Drawdown Recovery Plan
When you’ve hit a significant drawdown, returning to full activity immediately is almost always a mistake. Use a structured re-entry:
1. Stop trading: For a minimum of 1–3 days after hitting your drawdown limit.
2. Audit your trades: Review every trade from the drawdown period. Were the losses from the system working as intended (normal variance) or from discipline violations?
3. Identify the specific cause: Don’t generalize (“market was bad”). Be specific: “I removed 3 stop-losses,” or “I traded with 2% risk per trade during a news event.”
4. Reduce position size on return: Come back at 50% of normal position sizes for the first week. This gives you room to rebuild confidence without compounding the hole.
5. Set a milestone: Before returning to normal position sizes, require yourself to achieve 2 weeks of positive trading at reduced size.
6. Track recovery metrics separately: Know exactly when the account has returned to its previous peak. This is the moment the drawdown is fully recovered.
Drawdown in Prop Firm Challenges
For traders pursuing funded accounts through prop firms (FTMO, The Funded Trader, Apex, etc.), drawdown rules are typically strict and binary:
| Parameter | Typical Prop Firm Rule |
|---|---|
| Daily drawdown limit | 5% of starting balance |
| Overall drawdown limit | 10% of starting balance |
| Consequence of breach | Immediate account termination |
These limits are much tighter than personal account management. They require lower risk per trade (0.5–1%) and more conservative position management. The rules are not negotiable — crossing either limit ends the challenge with no exceptions.
For traders preparing for prop firm challenges, it’s worth practicing with these limits on a personal account first.
Drawdown vs. Loss: Understanding the Difference
A loss is the result of a closed trade that went negative. A drawdown is the aggregate decline in account equity over a period.
You can have 10 losing trades and a modest drawdown if each loss is small and some winners partially offset them. You can also have 3 losing trades and a catastrophic drawdown if those 3 losses each took 10% of the account.
Drawdown is determined by position sizing and compounding, not just by win/loss ratio.
This is why the 1% rule is so foundational. It limits the maximum contribution any single trade can make to your total drawdown.
Key Takeaways
- A drawdown is the peak-to-trough decline in account equity, expressed as a percentage
- Recovery from a drawdown requires a proportionally larger gain than the drawdown itself — a 50% drawdown requires 100% gain to recover. Avoid large drawdowns mathematically, not just emotionally.
- Normal drawdown ranges: 5–10% for beginners, 10–20% for experienced traders, 15–25% for professional strategies
- Set daily, weekly, and maximum drawdown limits in your trading plan before you need them — enforced mechanically, not emotionally
- When a limit is hit, stop trading for the defined period. Conduct an audit. Reduce position size on return. Track recovery explicitly.
- The cause of a drawdown determines the correct response: patience (normal variance), adaptation (regime change), rebuilding (system failure), or self-audit (discipline failure)
Next in this module: Risk vs. Reward | What Is Forex Leverage?

Ready to Practice This Strategy?
Test what you learned on a free, risk-free demo account before risking real money.