Volatility Stop-Loss: Using ATR to Size Stops for Current Market Conditions
The volatility stop-loss uses Average True Range to calibrate stop-loss distance to current market volatility — preventing stops that are too tight in volatile conditions and unnecessarily wide when markets are calm.
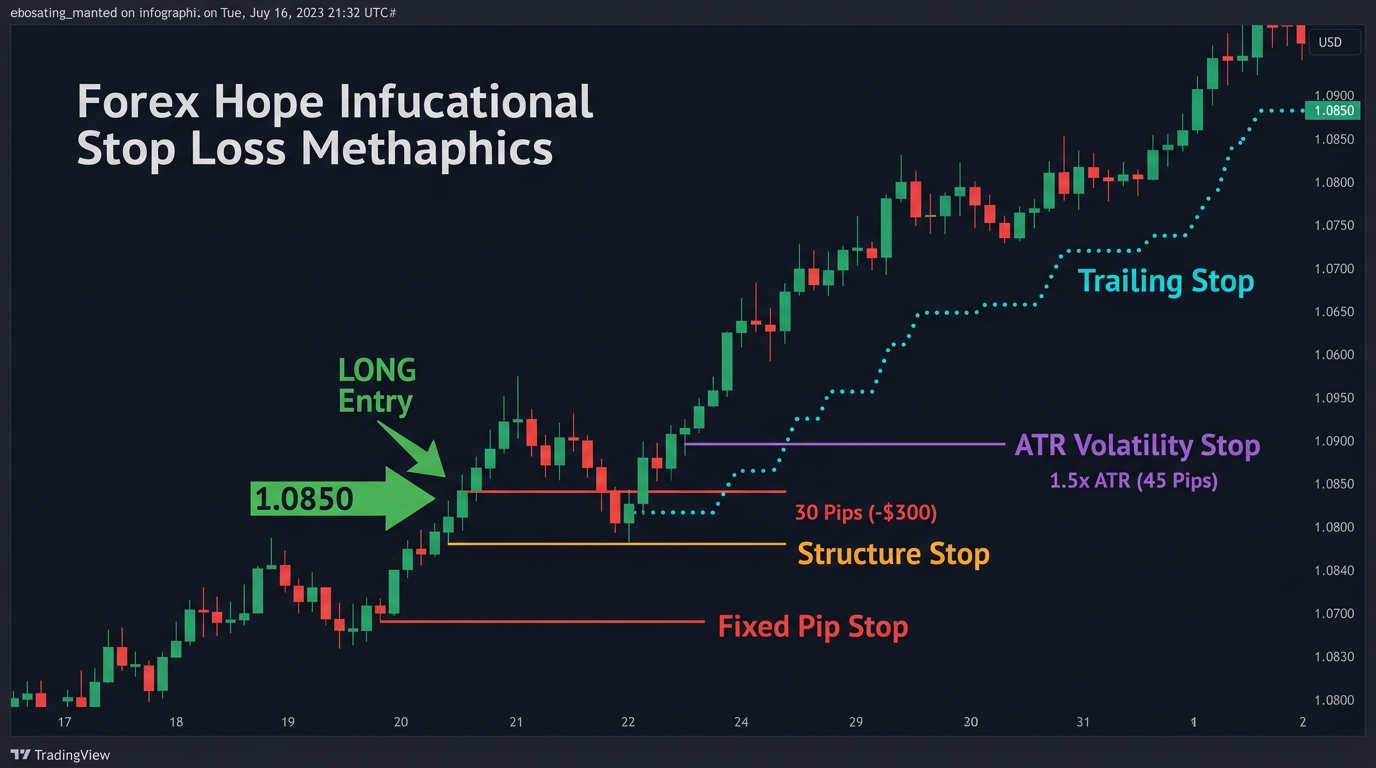
A fixed-pip stop-loss ignores the market. A 30-pip stop on EUR/USD in a quiet August week might be reasonable. The same 30-pip stop during an FOMC week when daily ranges are 150+ pips will be hit by ordinary intraday movement before the trade has a chance to develop.
The volatility stop-loss solves this by anchoring the stop distance to how much the market is actually moving right now — not how much you’re comfortable losing or what a round number feels like.
The Core Concept
Market volatility isn’t constant. It compresses during quiet consolidation phases and expands during news events, trend accelerations, and market stress. A stop-loss that fails to account for this will:
- Be too tight in high-volatility conditions → gets stopped out by noise
- Be too wide in low-volatility conditions → unnecessary capital at risk per trade
The Average True Range (ATR) measures current volatility in the same units as price (pips). Using a multiple of ATR as the stop distance produces a stop that automatically adjusts to whether the market is calm or volatile.
For a deep understanding of ATR itself, read the Average True Range lesson.
The ATR Stop Formula
Stop Distance = ATR(period) × Multiplier

Long stop = Entry Price − (ATR × Multiplier)
Short stop = Entry Price + (ATR × Multiplier)
Choosing the multiplier:
| Multiplier | Description | When to Use |
|---|---|---|
| 1.0× | Tight; close to average daily range | High-conviction setup; shorter TF trading |
| 1.5× | Standard; most common choice | Swing trading on 4H/Daily |
| 2.0× | Wide; tolerates larger retracements | Volatile pairs; uncertain conditions |
| 2.5× | Very wide | Daily chart position trades only |
The 1.5× multiplier is the standard starting point for most 4H swing trades. Adjust based on the pair’s typical behavior and your confidence in the entry precision.
Period Selection
The ATR period determines how many bars are included in the volatility calculation:
| ATR Period | What It Measures | Best For |
|---|---|---|
| 7-period | Short-term volatility (last 7 sessions) | Scalping and very short-term trades |
| 14-period (default) | Medium-term volatility | Most swing trading applications |
| 20-period | Smoothed long-term volatility | Position trading; daily chart analysis |
Timeframe interaction: ATR on the 4H chart gives you 4-hour volatility. For a swing trade held over several days, using the daily ATR (14-period) is more appropriate — it captures the pair’s full daily range, which is the volatility environment your trade will experience over its lifetime.
Practical Example: EUR/USD 4H
Setup: Bullish setup at support, entering long on EUR/USD.
Current conditions:
- EUR/USD 4H ATR (14-period): 52 pips
- Entry: 1.0840
- Multiplier choice: 1.5× (standard swing trade)
Calculation:
Stop Distance = 52 × 1.5 = 78 pips
Stop-Loss = 1.0840 − 0.0078 = 1.0762
Position sizing from this stop:
- Account: $5,000
- Risk: 1% = $50
- Pip value (1 standard lot EUR/USD): $10
Position Size = $50 / (78 × $10) = $50 / $780 = 0.064 lotsIn a high-volatility week when EUR/USD 4H ATR rises to 85 pips:
Stop Distance = 85 × 1.5 = 127 pips
Position Size = $50 / (127 × $10) = 0.039 lots
The position size automatically shrinks as volatility increases — maintaining the same dollar risk while adapting to market conditions.
Volatility Stop vs. Chart Stop: Which to Use?
These two stop methods are complementary, not competing:
| Method | Basis | Strength |
|---|---|---|
| Chart stop | Key support/resistance levels | Anchored to market structure |
| Volatility stop | ATR multiple | Adapts to current volatility |
| Hybrid (both) | Chart level + ATR cap | Best of both |
The hybrid approach: Place your stop at the chart structure level (below the last significant swing low for a long). Then check whether the required stop distance is within a reasonable ATR multiple:
- If chart stop = 45 pips and 1.5× ATR = 78 pips → chart stop is tighter; use chart stop, adjust position size for 45-pip risk
- If chart stop = 130 pips and 1.5× ATR = 78 pips → chart stop is unrealistically wide; the entry point is poor for this setup; consider skipping the trade or adjusting entry
When the chart stop significantly exceeds 2× ATR, it often signals that the entry is not precise enough. A better entry (closer to the structural level) produces a more reasonable stop distance.
ATR Trailing Stop
The volatility stop also applies to trailing:
Setup: You’re in a long trade, and it’s moving in your favor. Use ATR as the trailing stop mechanism:
Trailing Stop = Current Close − (ATR × 1.5)Update this after each candle close. The stop moves up as price advances but never moves down.
Example:
- Long EUR/USD, daily ATR (14) = 90 pips
- Trailing stop multiplier: 1.5×
- Price at 1.0950 → trailing stop at 1.0950 − 135 = 1.0815
- Price rises to 1.1020 → trailing stop updates to 1.1020 − 135 = 1.0885
- Price rises to 1.1080 → trailing stop at 1.1080 − 135 = 1.0945
This allows the trade to run through normal daily pullbacks (within 1.5× ATR) while closing if a genuine reversal occurs (a move more than 1.5× ATR against the position from the most recent high).
When NOT to Rely on ATR Stops
Immediately after a volatility spike: ATR lags — it averages recent bars. If there was an extraordinary volatility event yesterday (NFP surprise, flash crash), the 14-period ATR is inflated by that one bar. Your stop would be wider than appropriate for today’s actual conditions.
In thin liquidity periods: Asian session on quiet days produces very low ATR. Using an Asian ATR to size a position for the London session (which will be far more volatile) produces an artificially tight stop.
Solution: Use the daily ATR calculated from a stable period (excluding known outlier events) as the baseline, not the most recent intraday ATR during unusual market conditions.
Key Takeaways
- The volatility stop-loss uses ATR × multiplier as the stop distance, automatically adapting to current market volatility
- Standard multiplier for swing trades: 1.5× ATR on the 14-period ATR of the trading timeframe
- Position size is calculated from the ATR-based stop — as volatility rises, position size shrinks, keeping dollar risk constant
- Hybrid approach: use chart structure level as the primary stop, cross-check against ATR to verify the entry is precise enough
- When the chart stop exceeds 2× ATR, the entry point is likely imprecise — consider improving entry timing before placing the trade
- ATR trailing stops (1.5× ATR below the most recent close) allow winners to run through normal retracements while closing on genuine reversals
Next: Chart Stop-Loss | Average True Range
Tools: Position Size Calculator

Ready to Practice This Strategy?
Test what you learned on a free, risk-free demo account before risking real money.