EMA Explained: Exponential Moving Average in Forex Trading
The Exponential Moving Average responds faster to recent price changes than the SMA, making it better for entry timing and crossover signals. Learn the EMA calculation, the most useful periods, and how to apply it to your trading.
The Exponential Moving Average (EMA) is the SMA’s more reactive sibling. Both calculate an average of recent closing prices, but the EMA applies progressively more weight to recent prices — making it respond faster to price changes than the SMA.
This speed advantage makes the EMA more useful for entry timing and crossover-based systems where a quicker response to changing momentum matters. It also makes it slightly more prone to false signals in choppy markets — a tradeoff worth understanding before choosing between the two.
How the EMA Differs From the SMA
The SMA applies equal weight to every period in the calculation. The EMA applies a multiplier that gives exponentially more weight to the most recent closing price:
EMA Multiplier:
Multiplier = 2 / (n + 1)For a 20-period EMA: Multiplier = 2 / (20 + 1) = 0.0952 ≈ 9.52%
EMA Calculation:
EMA(today) = Close(today) × Multiplier + EMA(yesterday) × (1 - Multiplier)This means today’s closing price contributes 9.52% of the 20-period EMA value. Yesterday’s EMA (which itself incorporated the day before at 9.52%) contributes 90.48%. The further back a day is, the less it matters — exponentially.
Result: The EMA moves faster and tracks price more closely than the SMA with the same period number. When price reverses, the EMA turns before the SMA does.
The Most Useful EMA Periods
| Period | Typical Use | Best Timeframe |
|---|---|---|
| 9 EMA | Short-term momentum signal; fast crossover system | 1H, 4H |
| 12 EMA | MACD fast line; signal timing | 4H, Daily |
| 20 EMA | Short-term dynamic S/R; active trend reference | 1H, 4H |
| 21 EMA | Swing trading bounce entry; trailing stop | 4H, Daily |
| 26 EMA | MACD slow line | 4H, Daily |
| 50 EMA | Medium-term trend; institutional reference | 4H, Daily |
| 200 EMA | Long-term trend filter (same role as 200 SMA) | Daily |
The 9/21 EMA combination is widely used for swing trade entries: when the 9 EMA crosses above the 21 EMA, momentum has shifted bullish; below, bearish.
The 12 and 26 EMA are the direct inputs to MACD (Moving Average Convergence Divergence) — understanding the EMA is the foundation for understanding MACD.
EMA as Dynamic Support and Resistance
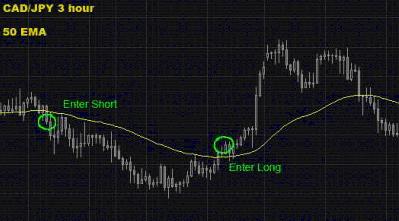
In trending markets, the EMA acts as a dynamic level that price returns to during pullbacks:
Uptrend pullback to 21 EMA:
- Pair is trending up on the 4H chart (price consistently above 21 EMA)
- Price pulls back toward the 21 EMA over 2–4 candles
- A bullish rejection candle forms at or near the 21 EMA
- Long entry at next 4H candle open; stop below the 21 EMA by 15 pips
- Target: previous swing high
This “pullback to EMA” setup is one of the cleanest, most consistently reliable entries in trend following. The EMA provides the dynamic support; the rejection candle provides the timing signal.
Which EMA to use for the bounce:
- Day trading (1H): 20 EMA
- Swing trading (4H): 21 EMA or 50 EMA
- Position trading (Daily): 50 EMA or 200 EMA
EMA Crossover Signals
When two EMAs of different periods cross, they signal a directional shift:
| Crossover | Signal | Interpretation |
|---|---|---|
| Fast EMA crosses above slow EMA | Bullish | Recent momentum is up; consider longs |
| Fast EMA crosses below slow EMA | Bearish | Recent momentum is down; consider shorts |
| Both EMAs sloping same direction | Trend confirmation | Align trades with EMA direction |
| EMAs tangled / crossing frequently | No trend | Avoid EMA crossover signals; market ranging |
Common crossover pairs:
- 9/21 EMA: Fast crossover system for intraday/swing
- 12/26 EMA: The basis for MACD
- 50/200 EMA: Long-term trend shifts (equivalent to Golden/Death Cross)
EMA in the MACD Indicator
MACD is calculated entirely from EMAs:
MACD Line = 12-period EMA − 26-period EMA
Signal Line = 9-period EMA of the MACD Line
Histogram = MACD Line − Signal Line
When you read MACD, you’re reading the relationship between two EMAs. Understanding this connection makes MACD interpretation far more intuitive — the MACD line being above zero simply means the 12 EMA is above the 26 EMA (short-term momentum is above medium-term momentum).
When to Use EMA vs. SMA
| Situation | Use |
|---|---|
| Identifying the major long-term trend | SMA (50, 200) |
| Timing entries in a trend | EMA (9, 20, 21) |
| Crossover trading systems | EMA (faster response) |
| Major institutional reference level | SMA (50, 200 SMA more widely cited) |
| Trailing stop in an active trade | EMA (faster to reflect new momentum) |
General guideline: Use SMA for the big picture; use EMA for execution. Many traders use the 200 SMA as their trend filter and the 20 or 21 EMA as their dynamic entry/exit level.
Key Takeaways
- The EMA weights recent prices more heavily than the SMA, making it faster to respond to price changes — useful for entry timing, crossover signals, and trailing stops
- Key calculation: EMA = Today’s Close × Multiplier + Yesterday’s EMA × (1 − Multiplier), where Multiplier = 2/(n+1)
- Most important EMA periods: 9/21 (crossover system), 12/26 (MACD inputs), 20/21 (dynamic S/R bounce), 50 (medium-term trend), 200 (long-term trend filter)
- The “pullback to EMA” setup is the EMA’s most practical application: wait for price to retrace to the 21 EMA in a trend, enter on a rejection candle
- MACD is derived entirely from EMAs — the MACD line is the 12 EMA minus the 26 EMA
- Use SMA for the major reference levels (50, 200) and EMA for entry timing and crossover systems
Next: SMA vs. EMA | Moving Averages Overview
Related strategies: MACD Trading System | EMA Crossover and ADX

Ready to Practice This Strategy?
Test what you learned on a free, risk-free demo account before risking real money.