SMA Explained: Simple Moving Average in Forex Trading
The Simple Moving Average is the most fundamental trend indicator in forex. Learn exactly how it's calculated, which SMA periods institutional traders watch most closely, and how to use the SMA as a trend filter and dynamic support/resistance level.
The Simple Moving Average calculates the arithmetic mean of closing prices over a specified number of periods. It’s one of the oldest tools in technical analysis, and despite being simple, it remains one of the most widely referenced levels in the forex market — from retail traders to global investment banks.
Its power comes precisely from its simplicity: because so many participants watch the same SMA levels, those levels tend to produce real price reactions.
How the SMA Is Calculated
The SMA adds the closing prices of the last n periods and divides by n:
SMA(n) = (Close₁ + Close₂ + ... + Closeₙ) / nExample — 5-period SMA:
If the last five EUR/USD daily closing prices are: 1.0842, 1.0856, 1.0871, 1.0849, 1.0868
SMA(5) = (1.0842 + 1.0856 + 1.0871 + 1.0849 + 1.0868) / 5
SMA(5) = 5.4286 / 5 = 1.0857
Each new candle close adds the new price and drops the oldest. The average “moves” forward through time — hence moving average.
The Most Watched SMA Periods in Forex
Not all SMA periods carry equal weight. These are the levels that institutional and retail traders reference most consistently:
| Period | Name | Significance |
|---|---|---|
| 10 SMA | Short-term trend | Intraday momentum; used by day traders |
| 20 SMA | Near-term trend | Basis of Bollinger Bands; active short-term S/R |
| 50 SMA | Medium-term trend | Critical institutional reference; watched globally |
| 100 SMA | Medium-long trend | Secondary institutional level; significant on 4H/Daily |
| 200 SMA | Long-term trend | Most important SMA in existence; defines bull/bear |
The 200 SMA on the daily chart is the single most referenced technical level in all of financial markets. Its significance is self-reinforcing: because traders from prop desks to hedge funds watch it, it consistently attracts order flow and produces meaningful price reactions.
Four Ways to Use the SMA
1. Trend Direction Filter
The slope and position of price relative to the SMA define the trend:
| Configuration | Interpretation |
|---|---|
| Price above 200 SMA (daily), SMA sloping up | Long-term uptrend; only take long setups |
| Price below 200 SMA (daily), SMA sloping down | Long-term downtrend; only take short setups |
| Price crossing the 200 SMA from below | Potential trend change; watch for confirmation |
| 50 SMA above 200 SMA | Intermediate bull alignment |
| 50 SMA below 200 SMA | Intermediate bear alignment |
This filter alone improves the win rate of most trading systems by eliminating counter-trend entries.
2. Dynamic Support and Resistance
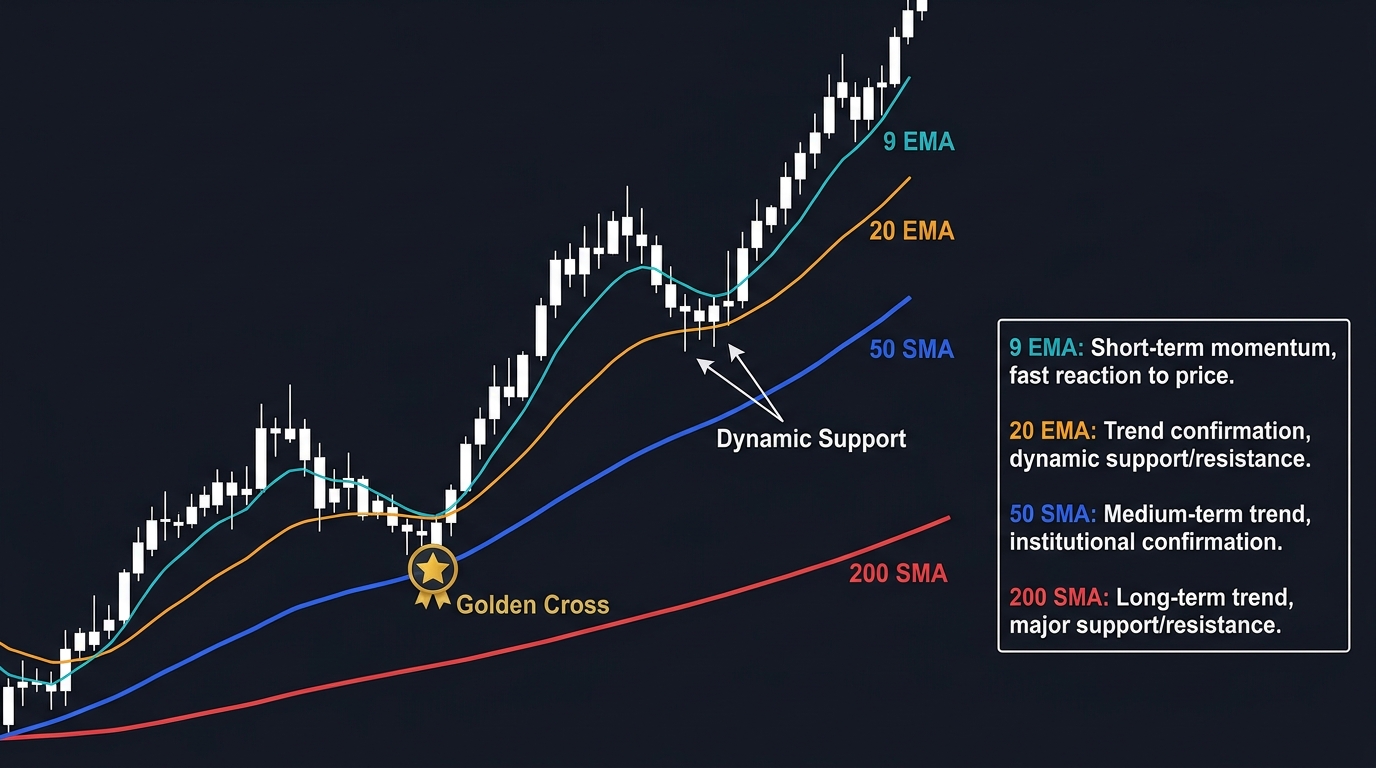
In a trending market, the SMA acts as a dynamic support (uptrend) or resistance (downtrend). Price frequently pulls back to a key SMA and bounces:
- In an uptrend on the 4H chart, price often pulls back to the 50 SMA and continues higher
- The SMA provides the entry zone; a rejection candle at the SMA is the entry signal
- Stop goes below the SMA; target is the previous swing high
3. SMA Crossovers (Golden Cross / Death Cross)
Golden Cross: 50 SMA crosses above 200 SMA → long-term bullish signal; significant directional bias shift
Death Cross: 50 SMA crosses below 200 SMA → long-term bearish signal
These crossovers generate major press coverage and institutional commentary when they occur on daily charts for major pairs. The market reaction is real — not because the math is magic, but because so many participants act on the same signal.
Limitation: Golden/Death Crosses lag significantly. By the time the 50 SMA crosses the 200 SMA, much of the move has already occurred. Use for directional bias, not entry timing.
4. SMA Ribbon
Multiple SMAs (e.g., 10, 20, 50, 100, 200) plotted simultaneously create a ribbon that visualizes trend alignment:
- All SMAs in ascending order (10 > 20 > 50 > 100 > 200), all sloping up: strong uptrend
- SMAs intertwining and crossing: consolidation or trend change in progress
- All SMAs in descending order: strong downtrend
SMA vs. EMA: When to Use Each
| Aspect | SMA | EMA |
|---|---|---|
| Responsiveness | Slower | Faster |
| Noise filtering | Better | Less |
| Use case | Trend identification; major level reference | Entry timing; crossover signals |
| Institutional reference | More widely used (50/200 SMA) | More widely used (short periods like 9/21) |
General rule: Use SMA for the major reference levels (50, 100, 200) that define trend context. Use EMA for shorter periods (9, 12, 20, 26) where faster responsiveness improves entry timing.
The full comparison is in the SMA vs. EMA lesson.
Common SMA Mistakes
Using too many SMAs simultaneously: Each SMA becomes a “line” you explain away when price doesn’t respect it. Two or three with specific roles is enough.
Changing SMA periods constantly: If price keeps cutting through your chosen SMA, the answer is not to change the period — it may be that the market is ranging and no SMA is reliably respected.
Treating SMA as an exact level: Price overshoots and undershoots SMAs regularly. Think of the 50 SMA ±10 pips as a zone, not a precise entry point.
Key Takeaways
- The SMA calculates the arithmetic mean of the last n closing prices; each new close adds one and drops the oldest
- The 200 SMA daily is the most referenced level in global forex markets — its significance is self-reinforcing because all major market participants watch it
- Four applications: trend direction filter (price above/below 200 SMA), dynamic S/R bounce entries, Golden/Death Cross directional bias, and SMA ribbon visualization
- Use the 50 and 200 SMA for trend context (slower, less noise); use EMAs for entry timing (faster, more responsive)
- Golden/Death Crosses lag significantly — use for bias direction only, not entry timing
- Think of major SMAs as zones (±5–15 pips), not exact levels; price regularly overshoots before reversing
Next: EMA Explained | SMA vs. EMA
Related strategies: Moving Averages Crossover | EMA Crossover and ADX

Ready to Practice This Strategy?
Test what you learned on a free, risk-free demo account before risking real money.