Forex Charts Basics: Bar Charts, Line Charts, and Candlesticks Compared
Every forex trader reads charts, but not all chart types are equal. Learn the three main chart types — line, bar, and candlestick — what each shows, and why candlestick charts are the standard for professional forex analysis.
Before learning any technical analysis, you need to read the data that analysis is built on. In forex, that data is price — and the way price is displayed on a chart determines how much information you can extract at a glance.
Three chart types are in common use. One has become the clear standard among professional and retail traders alike.
The Three Chart Types
Line Chart
The simplest chart type. A line connects consecutive closing prices into a continuous curve.
What it shows:
- The closing price at each time period
- The general direction of price over time
- Clean, uncluttered visual of trend direction
What it doesn’t show:
- The open, high, or low of each period
- Intraperiod volatility
- The magnitude of price swings
When line charts are useful:
- A quick visual scan of a long-term trend (daily or weekly)
- Comparing multiple currency pairs on one chart
- Identifying broad support and resistance without intraperiod noise
When they’re insufficient: For any trading decision. A line chart gives you closing prices only — you can’t see where price tested during the period, how volatile the period was, or where open-to-close momentum pointed.
Bar Chart (OHLC Chart)
Bar charts display all four price points — Open, High, Low, Close — for each period. Each bar consists of:
- Vertical line: Extends from the low (bottom) to the high (top)
- Left horizontal tick: The opening price
- Right horizontal tick: The closing price
A bar where the right tick is above the left tick (close > open) is bullish. The reverse is bearish.
What it shows:
- All four price points (OHLC) per period
- The period’s range (high to low)
- Whether price closed up or down
What it doesn’t show: The relationship between different parts of the period in visual terms. The body vs. wick distinction that candlesticks provide is absent.
Candlestick Chart
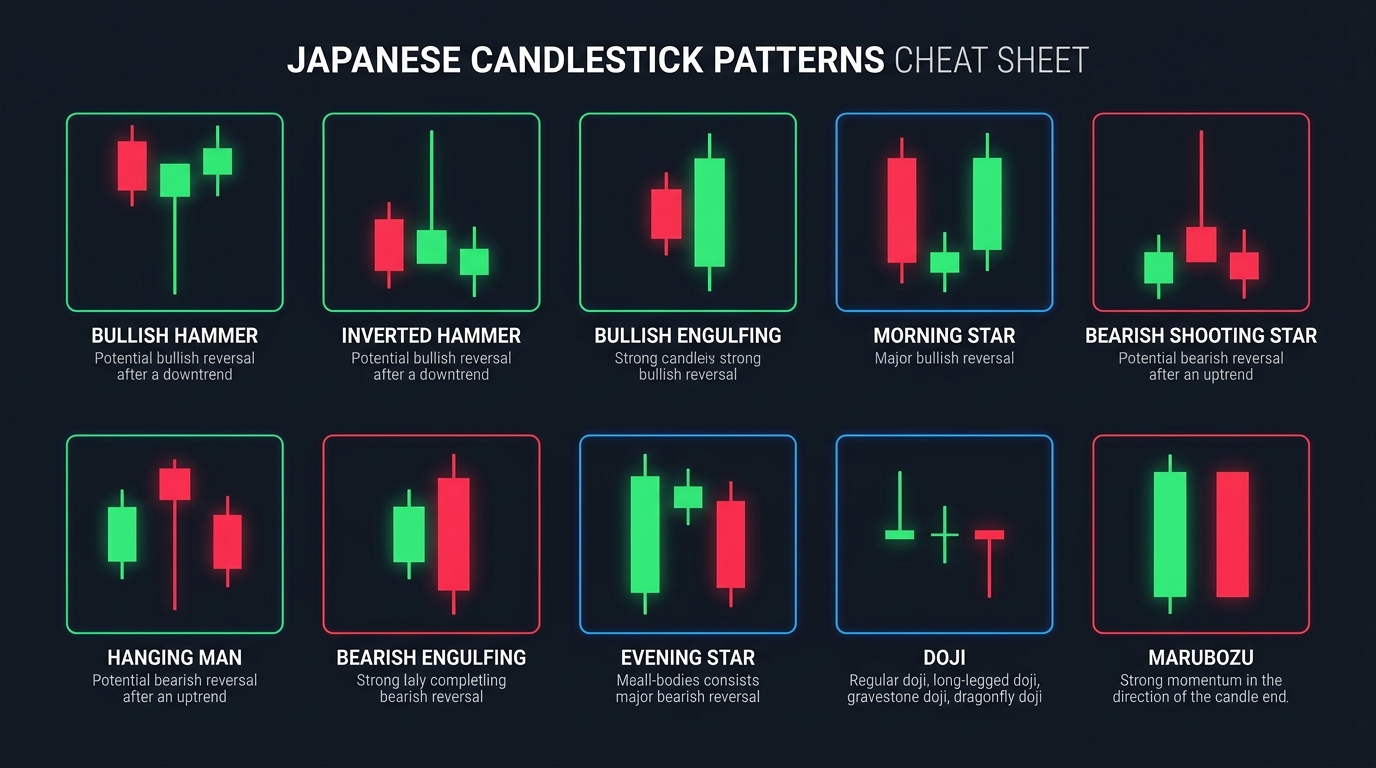
Candlestick charts display the same four data points as bar charts but visualize the open-to-close relationship as a rectangular “body” rather than two small ticks. Wicks extend from the body to the period’s high and low.
Components:
- Body (thick rectangle): The range between open and close
- Upper wick: The high above the body
- Lower wick: The low below the body
- Color: Green/white = close above open (bullish); Red/black = close below open (bearish)
Why candlesticks are the standard: The body size immediately communicates the significance of the move. A large body = strong conviction in one direction. A small body = indecision. Long wicks = rejection at extreme levels. This visual intuition takes a fraction of a second to process and is unavailable in bar charts.
The information advantage: The same price data presented as a candlestick chart versus a bar chart allows faster pattern recognition and more accurate reading of market sentiment.
Side-by-Side Comparison
| Feature | Line Chart | Bar Chart | Candlestick Chart |
|---|---|---|---|
| Shows Close | Yes | Yes | Yes |
| Shows Open | No | Yes | Yes |
| Shows High/Low | No | Yes | Yes |
| Body visualization | No | No | Yes |
| Visual speed of reading | Fast | Moderate | Fast |
| Pattern recognition | Limited | Moderate | Excellent |
| Industry standard | No | Partially | Yes |
| Best for | Quick trend overview | Some institutional use | Active trading |
Timeframes and Their Meaning
Each candle (or bar, or line point) represents one period of price action. The timeframe you choose determines the period length:
| Timeframe | Period | Best For |
|---|---|---|
| M1 (1 minute) | 1 minute of price | High-frequency scalping only |
| M5 (5 minutes) | 5 minutes | Scalping; London/NY open |
| M15 (15 minutes) | 15 minutes | Day trading setups |
| H1 (1 hour) | 1 hour | Day trading; swing entry timing |
| H4 (4 hours) | 4 hours | Swing trading primary timeframe |
| D1 (Daily) | 24 hours | Trend identification; position trading |
| W1 (Weekly) | 1 week | Macro trend; major S/R identification |
Multiple timeframe analysis: Professional traders use at least two timeframes simultaneously:
- Higher timeframe (Daily or Weekly): Identify trend direction and major levels
- Lower timeframe (1H or 4H): Time entries within that trend
A setup that looks compelling on a 15-minute chart but contradicts the daily trend has much lower probability of success than the same setup aligned with the daily direction.
Setting Up Your Chart
When you first open a trading platform (MT4, MT5, TradingView, cTrader), change the default settings to:
- Chart type: Japanese Candlestick
- Bullish candle color: Green or white
- Bearish candle color: Red or black
- Background: Dark (reduces eye strain during long sessions)
- Grid: Off or minimal (reduces visual clutter)
- Default timeframe: H4 for learning price structure
Indicators to start with (none): Looking at price action first — before adding indicators — is the most effective way to develop genuine chart reading skills. Add indicators only after you understand what they’re measuring in terms of underlying price.
Key Takeaways
- Three chart types: line (closing prices only, simple), bar/OHLC (all four prices, less visual clarity), candlestick (all four prices plus body/wick visualization — the industry standard)
- Candlestick charts are the universal standard in retail and professional forex trading because the body size communicates conviction, and wick length communicates rejection — both faster and more intuitively than bar charts
- Timeframes determine how much time each candle represents; use multiple timeframes: higher for trend direction, lower for entry timing
- For swing trading: Daily chart for trend, 4H for entry. For day trading: 4H for trend, 1H for entry. For scalping: 1H for trend, 5M/15M for entry
- Set up your chart with candlesticks, sensible colors, dark background, and minimal clutter before adding any indicators
- Develop chart-reading skills on pure price first; indicators add context to what price is already showing

Ready to Practice This Strategy?
Test what you learned on a free, risk-free demo account before risking real money.