Candlestick Charts: The Complete Pattern Reference for Forex Traders
Japanese candlestick patterns are the visual language of price action trading. Learn the 21 most important reversal and continuation patterns, what each means, and how to confirm them before entering a trade.
Japanese candlestick charts have been used to track rice price movements in Japan since the 18th century. Steve Nison introduced them to Western financial markets in his 1991 book Japanese Candlestick Charting Techniques, and within a decade, they had replaced bar charts as the default visualization in retail forex trading.
The reason they took over: a single candlestick contains more information than a bar of the same size, presented in a format that’s immediately intuitive to the human eye.
Reading a Single Candlestick
Each candlestick represents one period of price action — one minute, one hour, one day, depending on your chart setting.
The four components:
- Open: Where price started at the beginning of the period
- Close: Where price ended
- High: The highest point reached during the period
- Low: The lowest point reached
The body: The thick rectangle between open and close. A green (bullish) candle closes higher than it opened. A red (bearish) candle closes lower than it opened.
The wicks (shadows): The thin lines extending above and below the body. The upper wick shows the high; the lower wick shows the low. Long wicks indicate that price moved significantly in that direction but was rejected before the close.
The relationship between body size, wick length, and color tells a complete story about the battle between buyers and sellers during that period.
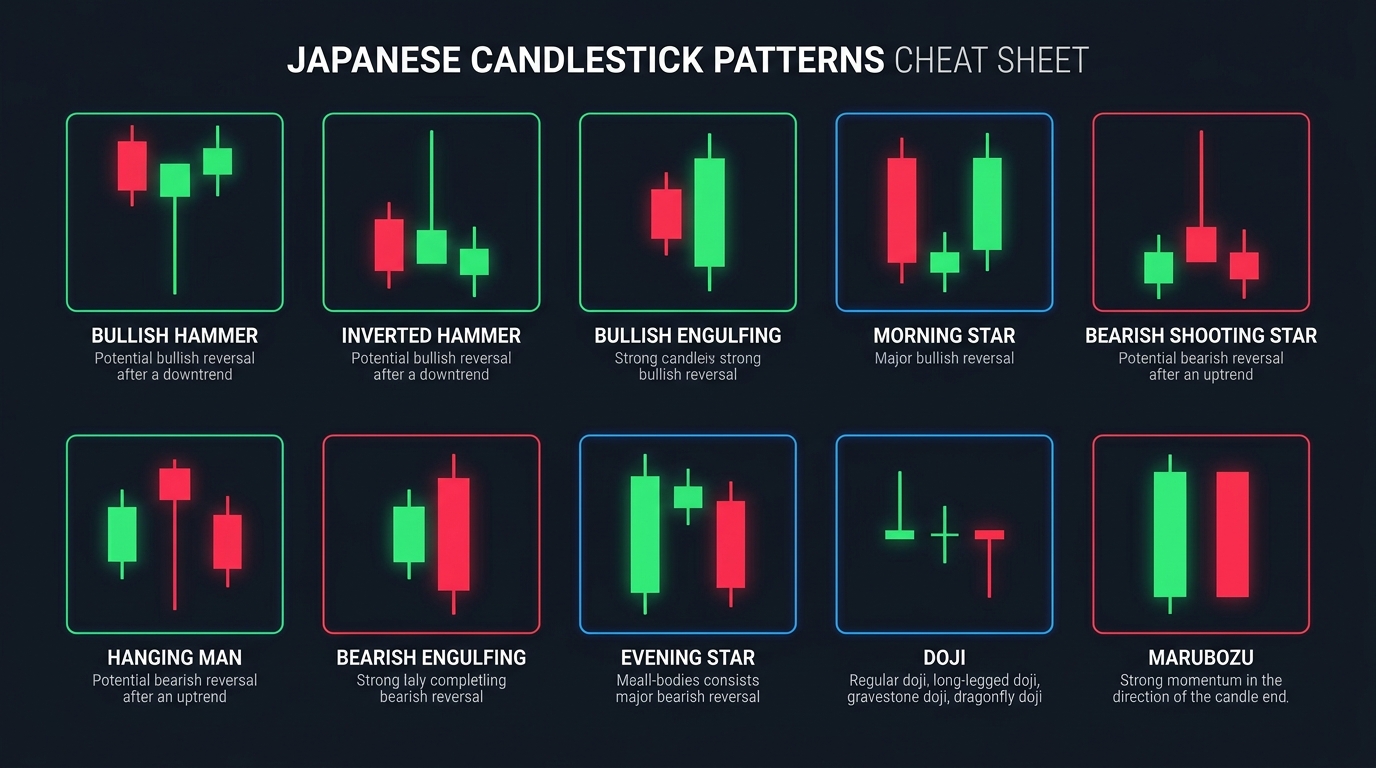
Single Candle Reversal Patterns
Hammer (Bullish Reversal)
Appearance: Small body at the top, very long lower wick (at least 2x the body length), little or no upper wick.
Meaning: Sellers pushed price significantly lower during the period, but buyers stepped in and drove it back up to close near the open. The long lower wick is evidence of buyer rejection at the lows.
Where it’s valid: At the bottom of a downtrend or at a key support level.
Confirmation: The following candle closes above the hammer’s high. Without confirmation, it’s just a candle.
Hanging Man (Bearish Reversal)
Appearance: Identical shape to the Hammer — small body at top, long lower wick.
Meaning: The difference is context. When this shape appears at the top of an uptrend or at a resistance level, it signals that buyers are struggling and sellers are beginning to assert control.
Where it’s valid: At the top of an uptrend or at a key resistance level.
Shooting Star (Bearish Reversal)
Appearance: Small body at the bottom, very long upper wick, little or no lower wick.
Meaning: Buyers pushed price significantly higher during the period, but sellers rejected the advance and drove price back down to close near the open. The long upper wick is evidence of seller dominance at the highs.
Where it’s valid: At the top of an uptrend or at a resistance zone.
Inverted Hammer (Bullish Reversal)
Appearance: Identical to Shooting Star — small body at bottom, long upper wick.
Context makes it bullish: When this shape appears at the bottom of a downtrend, it signals that buyers attempted an advance (upper wick) and while they didn’t hold the high, the appearance of buying pressure at a low is a potential reversal signal.
Requires strong confirmation: The next candle must close decisively bullish.
Doji (Indecision)
Appearance: Open and close are identical or virtually identical, creating a very thin or nonexistent body. Can have long wicks in both directions.
Meaning: Complete indecision. Buyers and sellers are in perfect equilibrium for this period. By itself, a Doji means nothing. At a key S/R level after a sustained trend, it signals that the trend is losing conviction.
Types of Doji:
- Standard Doji: Cross-shaped; balanced wicks
- Long-Legged Doji: Very long wicks in both directions; extreme indecision
- Dragonfly Doji: Long lower wick, no upper wick; bullish implication at lows
- Gravestone Doji: Long upper wick, no lower wick; bearish implication at highs
Marubozu (Continuation)
Appearance: Full-body candle with no wicks (or very minimal). Open = Low (bullish) or Open = High (bearish). Close = High (bullish) or Close = Low (bearish).
Meaning: Overwhelming dominance by one side throughout the entire period. No rejection, no hesitation. The trend direction is strong.
Where it’s valid: In the direction of the established trend. A bullish Marubozu mid-uptrend is a continuation signal.
Two-Candle Reversal Patterns
Engulfing Candle (Bullish or Bearish Reversal)
Bullish Engulfing: After a downtrend, a large bullish candle completely engulfs (has a body larger than) the previous bearish candle. This sudden overpowering of sellers by buyers is a strong reversal signal.
Bearish Engulfing: After an uptrend, a large bearish candle completely engulfs the previous bullish candle. Strong reversal signal.
Key requirement: The second candle must fully contain the first candle’s body. The larger the second candle relative to the first, the stronger the signal.
Tweezer Tops and Bottoms
Tweezer Bottom (Bullish): Two consecutive candles with virtually identical lows. The first is bearish, the second is bullish. Signals that a specific price level has been tested twice and held — a defined support floor.
Tweezer Top (Bearish): Two consecutive candles with virtually identical highs. First bullish, second bearish. Signals resistance at that level.
Piercing Line (Bullish) and Dark Cloud Cover (Bearish)
Piercing Line: After a downtrend, a bearish candle is followed by a bullish candle that opens below the previous close but closes above the midpoint of the previous bearish candle.
Dark Cloud Cover: After an uptrend, a bullish candle is followed by a bearish candle that opens above the previous close but closes below the midpoint of the previous bullish candle.
Both patterns show a significant push in the opposite direction that reclaims more than 50% of the previous candle — but not full engulfing. Moderate reversal strength.
Three-Candle Reversal Patterns
Morning Star (Bullish Reversal)
One of the most reliable three-candle patterns:
- First candle: Large bearish candle (continuing the downtrend)
- Second candle: Small-bodied candle or Doji (gapping down if possible) — indecision
- Third candle: Large bullish candle closing above the midpoint of the first candle
Meaning: The downtrend drives price lower (first candle), stalls into indecision (second candle), then buyers take over decisively (third candle). The recovery above the first candle’s midpoint confirms the reversal.
Evening Star (Bearish Reversal)
The mirror pattern at the top of an uptrend:
- First candle: Large bullish candle
- Second candle: Small body or Doji (gapping up if possible)
- Third candle: Large bearish candle closing below the midpoint of the first candle
Three White Soldiers (Bullish Continuation/Reversal)
Three consecutive bullish candles, each opening within the body of the previous candle and closing progressively higher. Each candle has little or no upper wick.
Meaning: Strong, sustained buying pressure over three periods. Particularly significant when appearing after a downtrend or at a key support zone.
Note: When Three White Soldiers appear after a long uptrend, they can also mark exhaustion — use context.
Three Black Crows (Bearish Continuation/Reversal)
Three consecutive bearish candles, each opening within the body of the previous candle and closing progressively lower. Each with little or no lower wick.
Meaning: Strong, sustained selling pressure. Reliable at the top of an uptrend.
Continuation Patterns
Rising Three Methods (Bullish Continuation)
A large bullish candle, followed by three or four small-bodied candles that decline slightly (but stay within the range of the first candle), then a final large bullish candle that closes above the first candle’s high.
Meaning: The main trend paused briefly to consolidate, then continued. The bulls are still in control.
Falling Three Methods (Bearish Continuation)
Identical in structure but inverted: large bearish candle, small counter-move candles, then large bearish continuation.
Quick Reference: Pattern Reliability Summary
| Pattern | Direction | Reliability | Required Context |
|---|---|---|---|
| Engulfing | Both | High | At S/R level + trend context |
| Morning/Evening Star | Both | High | At S/R level |
| Three White Soldiers | Bullish | High | After downtrend or at support |
| Three Black Crows | Bearish | High | After uptrend or at resistance |
| Hammer / Shooting Star | Both | Medium-High | At key S/R level only |
| Doji | Neutral | Medium | Only significant at S/R |
| Piercing Line / Dark Cloud | Both | Medium | After extended trend |
| Tweezer Top/Bottom | Both | Medium | At tested S/R level |
| Marubozu | Continuation | Medium | In established trend |
The Golden Rule: Context Over Pattern
A Hammer at random mid-range is just a candle. A Hammer at the 61.8% Fibonacci retracement level coinciding with a key support zone after a 5-day downtrend, with RSI approaching oversold — that’s a high-probability entry.
Candlestick patterns are not magic. They are visual representations of buyer-seller dynamics that carry statistical significance when they appear in the right context. Learn to read the context before you read the pattern.
Key Takeaways
- Candlestick bodies show the open-to-close range; wicks show the high-low extremes; the relationship between them tells the story of who controlled the period
- Single candle patterns (Hammer, Shooting Star, Doji, Marubozu) are informational — they require confirmation from the next candle
- Two-candle patterns (Engulfing, Tweezer, Piercing Line) are more decisive — the second candle provides immediate context
- Three-candle patterns (Morning Star, Three White Soldiers) are the highest-reliability single-sequence signals
- Context is everything: a pattern at a key S/R level is significantly more reliable than the same pattern in open space
- Always wait for the pattern candle to close before acting — and require at least one confirming candle for single and two-candle patterns

Ready to Practice This Strategy?
Test what you learned on a free, risk-free demo account before risking real money.