Moving Averages in Forex: SMA, EMA, and How to Use Them
Moving averages are the foundation of trend-following analysis. Learn how SMA and EMA are calculated, how to use them for trend direction, dynamic support/resistance, and entry timing.
If there is one tool that every forex trader uses — scalpers, swing traders, position traders, algorithmic systems — it’s the moving average. Not because it’s the most sophisticated indicator, but because it does one thing exceptionally well: it cuts through the noise of individual candles to show you the underlying direction of the market.
Understanding moving averages at a deep level is foundational. Everything from MACD to Bollinger Bands to EMA crossover strategies is built on the same core concept. Get this right and the rest of technical analysis becomes significantly clearer.
What Is a Moving Average?
A moving average calculates the average closing price of a currency pair over a specified number of periods, then plots that average as a continuous line on the chart.
Simple example: If you’re calculating a 5-period SMA and the last five closing prices were: 1.0840, 1.0855, 1.0862, 1.0849, 1.0871
SMA = (1.0840 + 1.0855 + 1.0862 + 1.0849 + 1.0871) / 5 = 1.0855
As each new candle closes, the oldest data point drops off and the newest is added. The average “moves” forward with price — hence the name.
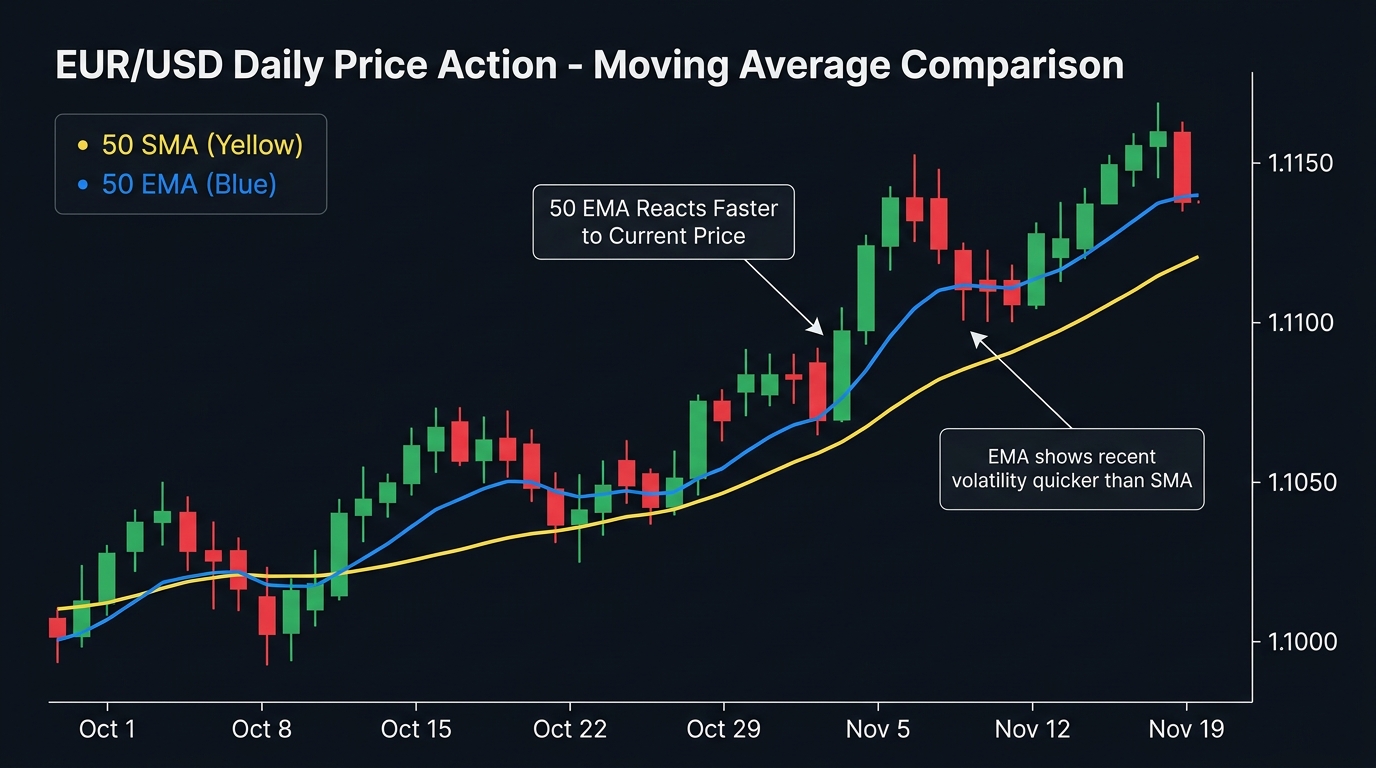
Simple Moving Average (SMA) vs. Exponential Moving Average (EMA)
The two most important types differ in how they weight each data point:
| Feature | SMA | EMA |
|---|---|---|
| Calculation | Equal weight to all periods | More weight on recent periods |
| Response to price | Slow, smooth | Fast, reactive |
| False signals | Fewer (lag filters noise) | More (reacts too fast sometimes) |
| Best use | Trend identification on higher TFs | Entry timing, crossover systems |
| Common settings | 50, 100, 200 | 9, 12, 20, 26, 50 |
Neither is better — they serve different purposes. A complete technical setup often uses both: an SMA for the long-term trend and an EMA for entry timing.
The Most Important Moving Average Periods
Not all periods are equal. These are the most widely watched:
| Period | Type | Why It Matters |
|---|---|---|
| 9 EMA | EMA | Short-term momentum; used in many scalping and day trading setups |
| 20 EMA | EMA | Common dynamic support/resistance on 1H and 4H charts |
| 50 SMA | SMA | Medium-term trend; critical level watched by institutions |
| 100 SMA | SMA | Secondary institutional level; significant on daily charts |
| 200 SMA | SMA | The single most watched moving average; defines long-term trend |
The 200 SMA on the daily chart is particularly important. Price above the 200 SMA = long-term uptrend. Price below = long-term downtrend. This single data point is referenced by traders from retail to Goldman Sachs.
How to Use Moving Averages: Five Applications
Application 1: Trend Direction
The simplest use. The slope of the moving average tells you trend direction:
- MA sloping up: Uptrend
- MA sloping down: Downtrend
- MA flat: Ranging / consolidation
Use the 50 SMA or 200 SMA on the daily chart as your baseline trend indicator. If price is above the 200 SMA, your default bias is long. Below it, short. This single filter eliminates the most common beginner mistake: trading against the dominant trend.
Application 2: Dynamic Support and Resistance
In a trending market, moving averages act as dynamic support (uptrend) or resistance (downtrend). Price frequently pulls back to a key MA and bounces.
How to use it:
- Identify an uptrend (price consistently above the 50 EMA on 4H)
- Wait for a pullback to the 50 EMA
- Watch for a rejection candle at the EMA level
- Enter long with a stop below the EMA
- Target the previous swing high
This “bounce off the MA” setup is one of the most consistently used entries in swing trading.
Which MA to use for bounces:
- Scalping / 1H: 20 EMA or 50 EMA
- Swing / 4H: 50 EMA or 100 SMA
- Position / Daily: 50 SMA or 200 SMA
Application 3: Golden Cross and Death Cross
When two moving averages cross, they generate a directional signal:
Golden Cross: 50 SMA crosses above 200 SMA
- Interpretation: Long-term bullish shift
- Significance: Very widely watched; often followed by institutional positioning
- How to use: Establishes a bullish bias for medium-term trading
Death Cross: 50 SMA crosses below 200 SMA
- Interpretation: Long-term bearish shift
- How to use: Establishes bearish bias; prioritize short setups
Important: These are confirming signals, not entry triggers. The Golden Cross often appears after price has already risen significantly. Use it for directional bias, not for precise timing. The crossover closest to zero (EMA crossovers on shorter timeframes) produces better entry timing than the lagging 50/200 cross.
Application 4: Moving Average Ribbon
A moving average ribbon uses multiple MAs simultaneously to visualize trend strength and momentum:
Bull ribbon: Shorter MAs above longer MAs, all fanning upward (e.g., 10 EMA > 20 EMA > 50 SMA > 100 SMA) — strong uptrend Bear ribbon: Opposite alignment — strong downtrend Ribbons contracting / intertwining: Trend is losing momentum; potential consolidation
The ribbon provides more information than any single MA, at the cost of chart complexity.
Application 5: Price Relative to MA — The Filter
Before entering any trend-following trade:
- If price is above the 200 SMA: only take long setups
- If price is below the 200 SMA: only take short setups
- If price is within 0.5% of the 200 SMA: consider both directions valid; wait for clarity
This filter alone significantly improves the statistical performance of most moving average crossover strategies.
Common Moving Average Mistakes
Using too many MAs simultaneously: Three or more MAs on one chart often produce contradictory information. Pick two or three with specific roles and stick to them.
Changing periods when the system underperforms: Adjusting MA periods until they fit past data (curve fitting) produces strategies that fail forward. Choose your periods based on logic, not optimization.
Treating the MA line as an exact level: Price often “overshoot” or “undershoot” a moving average slightly. Think of the MA as a zone (±5–10 pips on major pairs) rather than a single precise price.
Ignoring the market condition: Moving averages work in trending markets. In a defined ranging market (ADX below 20, price oscillating between fixed S/R), MAs generate false crossover signals constantly. Check ADX before using MA-based signals.
Combining Moving Averages With Other Indicators
MA + RSI: Use 200 SMA for trend bias, RSI for momentum confirmation. Buy when price is above 200 SMA and RSI pulls back to 40–50 then bounces upward.
MA + MACD: MACD is itself built from EMAs, but using it alongside a simple trend-direction MA (200 SMA) prevents MACD counter-trend signals in strongly trending markets.
MA + Volume: A moving average bounce accompanied by above-average volume is significantly more reliable than one occurring on thin volume.
Key Takeaways
- Moving averages smooth price noise to reveal the underlying trend; the slope tells you direction, the position of price relative to the MA tells you the trend context
- SMA (equal weighting) is better for trend identification on higher timeframes; EMA (recent-price weighted) is better for entry timing
- The 200 SMA on the daily chart is the single most widely watched technical level in forex trading
- Five key applications: trend direction, dynamic support/resistance bounces, Golden/Death Cross directional shifts, MA ribbon visualization, and the “only trade in the MA direction” filter
- Moving averages work best in trending markets (ADX above 25); in ranging markets, they generate excessive false signals
- Don’t use more than 2–3 MAs simultaneously; each one should have a defined role
Next: SMA Explained | EMA Explained | SMA vs. EMA
Related strategies: Moving Averages Crossover
Tools: Position Size Calculator

Ready to Practice This Strategy?
Test what you learned on a free, risk-free demo account before risking real money.