SMA vs. EMA: Which Moving Average Should You Use?
SMA and EMA process the same price data differently. Learn the exact tradeoffs — response speed, false signal frequency, and best use cases — to decide which moving average belongs in your trading system.
Both the SMA and EMA calculate a moving average of recent closing prices. The difference is weighting: the SMA treats all periods equally; the EMA gives more weight to recent prices. This single difference has practical consequences that should guide which you use for specific applications.
Neither is universally better. The right answer depends on what you’re using the moving average for.
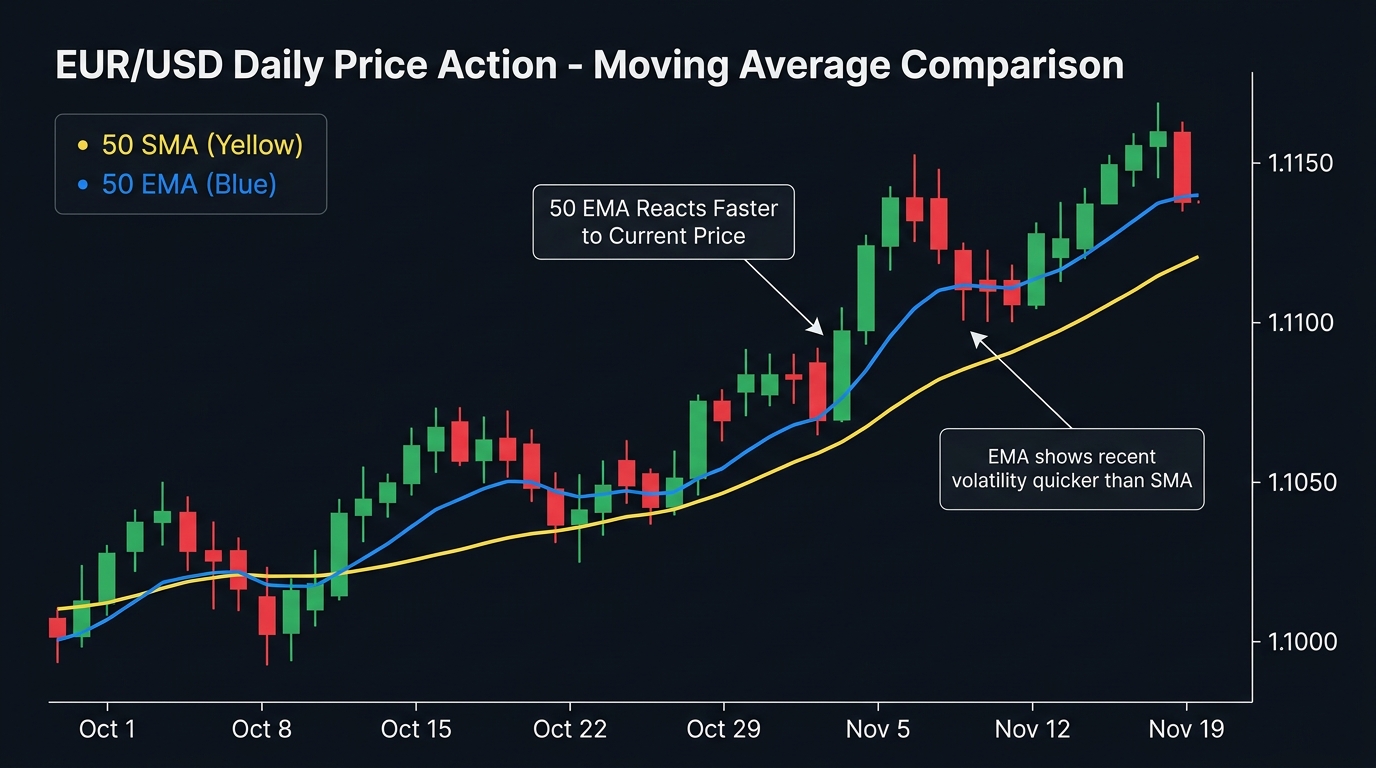
The Core Difference Illustrated
Consider EUR/USD making a sudden sharp move of 100 pips in one day after a news release.
20-period SMA response: The one-day spike represents 1/20th (5%) of the total calculation. The SMA barely moves.
20-period EMA response: The EMA multiplier for a 20-period EMA is 9.52%. The spike contributes 9.52% of today’s EMA value. The EMA jumps noticeably.
After the spike reverses the next day:
- SMA: Still includes the spike (it stays for 20 sessions before dropping off)
- EMA: Quickly moves back as today’s new close dominates
This shows why the EMA responds faster to price changes — in both directions.
Direct Comparison
| Aspect | SMA | EMA |
|---|---|---|
| Response to price changes | Slow | Fast |
| Effect of one outlier candle | Minimal (1/n weighting) | More significant (higher recent weight) |
| False signals in ranging markets | Fewer | More frequent |
| Lag in trending markets | More | Less |
| Visual smoothness | Smoother | Less smooth |
| Best for major reference levels | Yes (50, 200 SMA) | Less common at these levels |
| Best for entry timing | Less ideal | Yes (9, 20, 21 EMA) |
| Widely cited by institutions | Yes | Less so for major levels |
When SMA Outperforms
Trend identification on higher timeframes: The 200 SMA on the daily chart is the most referenced technical level in forex markets. Because it’s slow and smooth, it provides a stable baseline for the long-term trend. Using the 200 EMA instead misses a portion of this self-reinforcing significance.
Filtering noise in ranging markets: In a choppy market where price oscillates without direction, the EMA’s faster response causes it to signal crossovers and S/R bounces that quickly reverse. The SMA’s slower reaction ignores more of this noise, producing fewer false signals.
Clean slope reading: The SMA’s smooth line makes its slope (up/flat/down) easier to read at a glance than the more reactive EMA.
When EMA Outperforms
Entry timing within a trend: When you’re using a moving average as a dynamic support level to enter on pullbacks, you want the level to reflect current price behavior, not data from 3 weeks ago. The 21 EMA updates more quickly than the 21 SMA and provides a more accurate reflection of where current trend momentum sits.
Crossover systems: EMA crossovers (9/21, 12/26) produce earlier signals than SMA crossovers because the fast EMA responds to price shifts first. For a system designed around crossover timing, earlier is better (up to the point of producing too many false signals).
Trailing stops: Using an EMA as a trailing stop in an active trend ensures the stop level stays closer to current price — if price reverses sharply, the EMA stop triggers faster than an SMA stop would.
The Professional Approach: Use Both
The most common approach among experienced traders is using SMA and EMA for different roles simultaneously:
| Role | Moving Average | Period |
|---|---|---|
| Long-term trend filter | SMA | 200 SMA Daily |
| Medium-term trend context | SMA | 50 SMA Daily |
| Dynamic S/R for swing entries | EMA | 21 EMA 4H |
| Crossover entry signal | EMA | 9 EMA × 21 EMA |
| Trailing stop in active trade | EMA | 21 EMA |
Example usage:
- Check price vs. 200 SMA daily → establishes long-term directional bias
- Wait for price to pull back to 21 EMA on 4H → provides entry zone
- Enter on rejection candle at 21 EMA → precise entry
- Trail stop using 21 EMA as trade advances → dynamic exit
This two-level approach uses the SMA’s stability for the big picture and the EMA’s responsiveness for execution.
Popular Periods Recap
| Period | Type | Primary Use |
|---|---|---|
| 9 | EMA | Fast signal line; crossover systems |
| 12 | EMA | MACD fast component |
| 20 | SMA / EMA | Short-term S/R; Bollinger Bands basis |
| 21 | EMA | Swing trading S/R; trailing stop |
| 26 | EMA | MACD slow component |
| 50 | SMA | Medium-term institutional reference |
| 100 | SMA | Secondary institutional level |
| 200 | SMA | The most-watched level in forex |
Key Takeaways
- SMA is slower; EMA is faster — the difference is weighting (SMA equal weight, EMA more weight on recent prices)
- SMA outperforms at major reference levels (50, 200) where institutional significance and stability matter; EMA outperforms for entry timing and crossover signals
- In ranging markets, SMA produces fewer false signals; in trending markets, EMA lags less
- Use SMA for the big picture (200 SMA daily = long-term trend) and EMA for execution (21 EMA 4H = pullback entry zone and trailing stop)
- The 12 and 26 EMA are the inputs to MACD — understanding them deepens MACD comprehension significantly
- There is no universally “better” moving average; define the role first, then choose the type that best serves it
Previous: SMA Explained | EMA Explained

Ready to Practice This Strategy?
Test what you learned on a free, risk-free demo account before risking real money.