Pivot Points and Market Sentiment: How to Read Institutional Bias
Pivot points reveal not just support and resistance levels — they tell you how the market is positioned relative to a daily or weekly reference point. Learn to read the position of price relative to PP as a market sentiment gauge.
Most traders use pivot points as simple horizontal support and resistance levels. But the central pivot point (PP) serves a secondary function: as a daily market sentiment gauge.
Where price opens relative to PP, and where it trades throughout the day relative to PP, tells you the collective positioning of the market for that session.
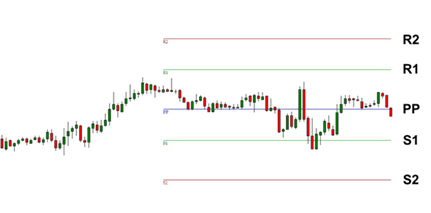
The Pivot Point as Sentiment Reference
The central pivot point is the arithmetic mean of the previous session’s high, low, and close:
PP = (Previous High + Previous Low + Previous Close) / 3Because it averages the full range of the previous day’s activity, it represents the fair value around which the next day begins. When the current day’s price opens above PP, the market is starting above yesterday’s average — a bullish opening disposition. Below PP: bearish.
The daily bias rule:
| Session Position | Interpretation | Trader Implication |
|---|---|---|
| Price opens above PP | Bullish daily bias | Prefer long setups; look for longs at S1 or PP |
| Price opens below PP | Bearish daily bias | Prefer short setups; look for shorts at R1 or PP |
| Price oscillates around PP | Indecision / no conviction | Reduce trading; wait for directional commitment |
| Price moves from below PP to above it | Sentiment shift to bullish | Potential trend change or acceleration |
Reading Intraday Sentiment Progression
The relationship between price and the pivot levels throughout the session tells a story about how sentiment evolves:
Bullish scenario:
- Opens above PP
- Holds above PP through the morning session
- Breaks through R1 in the NY session
- → Strong bullish day; institutional buyers in control
Bearish scenario:
- Opens above PP
- Falls back through PP and cannot reclaim it
- Breaks S1 by early NY session
- → Sentiment flipped bearish despite bullish open; consider shorts
Indecision scenario:
- Price oscillates between PP and R1 (or PP and S1) all day without meaningful breakout
- Closing near PP
- → Low-conviction day; avoid trend positions; scalping between PP and R1/S1 only
Pivot Levels as Commitment Tests
Each pivot level tests whether the market has sufficient conviction to hold the directional move:
R1 holds repeatedly: Sellers at R1 are stronger than buyers — bearish signal. If price tests R1 3+ times without closing above it, consider a short from R1 toward PP.
S1 holds repeatedly: Buyers at S1 are absorbing selling — bullish signal. If price tests S1 3+ times without closing below it, consider a long from S1 toward PP.
R1 breaks on first attempt: Bullish conviction is strong — price likely to reach R2. Add to long positions.
S1 breaks on first attempt: Bearish conviction is strong — price likely to reach S2. Stay short or add.
Weekly Pivots for Broader Sentiment
Daily pivot points reset every day. Weekly pivot points — calculated from the previous week’s high, low, and close — provide a broader sentiment context:
When price is above the weekly PP: The broad weekly bias is bullish; intraday traders should lean toward longs unless daily pivots suggest a temporary reversal.
When price is below the weekly PP: Weekly bias is bearish; lean toward shorts intraday.
The weekly/daily alignment: The strongest scenarios occur when both weekly and daily bias agree — price above both weekly and daily PP is the most bullish intraday condition.
Combining Pivot Sentiment With Other Indicators
Pivot point sentiment analysis is most useful when combined with:
Session bias: If the London session opens above PP and drives into R1 with conviction, the NY open provides an opportunity to enter longs on the R1 retest (now acting as support) with the full London-established trend behind the trade.
MACD/RSI: If sentiment turns bearish (price falls below PP) and MACD is crossing bearish below zero, the dual confirmation strengthens the short bias.
News alignment: If the morning’s economic data (PMI, retail sales) came in below expectations for the pair’s base currency, and price has already fallen below PP, both fundamental and technical sentiment align bearish.
Key Takeaways
- The central pivot point (PP) represents the previous session’s price fairness reference: above it is bullish disposition, below it is bearish
- Daily bias is established at the open: opening above PP favors longs; below PP favors shorts; oscillation around PP signals indecision
- Test the conviction: if R1 holds on multiple tests, sellers are strong (bearish signal); if it breaks on first attempt, buyers have conviction
- Weekly pivots provide a broader sentiment context — when daily and weekly bias align in the same direction, the setup is highest conviction
- Pivot sentiment analysis is most useful combined with session awareness, momentum indicators (MACD/RSI), and news alignment
- Low-conviction days (price hovering near PP without commitment) are signals to reduce position sizes and avoid trend positions
Related lesson: Pivot Points Trading | Support and Resistance Levels
Related strategies: News Trading

Ready to Practice This Strategy?
Test what you learned on a free, risk-free demo account before risking real money.