Fibonacci Retracement and Trend Lines: How to Combine Two Tools
Using Fibonacci retracement alongside trend lines creates more precise entry zones than either tool alone. Learn the two primary methods for combining them and the specific confluence conditions that produce the highest-probability setups.
The Fibonacci retracement and the trend line are two of the most widely used tools in forex technical analysis. Used individually, both produce valid setups. Used together, the confluence of a Fibonacci level coinciding with a trend line creates a significantly stronger entry zone — because two independent methods point to the same price at the same time.
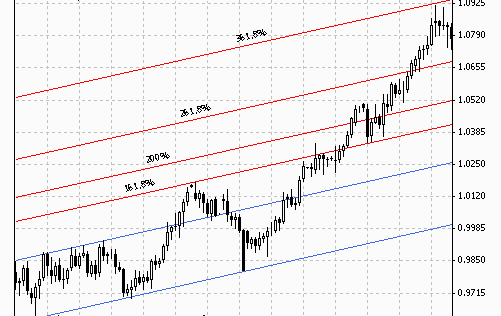
Why Confluence Works
When two different analytical tools converge at the same price level, the probability of that level producing a meaningful price reaction increases. The reason is structural:
- Trend line touch: Traders who have drawn the trend line watch for a bounce; they place buy orders at the trend line
- Fibonacci 61.8%: Traders using Fibonacci watch the same zone; they also place buy orders at the 61.8% retracement
- Combined: Both groups are buying at approximately the same price — the combined order flow makes the level more likely to hold
This is the core logic behind all confluence trading: independent analytical frameworks reinforcing the same level create denser order concentration and stronger price reactions.
Method 1: Fibonacci Level + Uptrend Line
Setup for a long trade:
Step 1: Draw an uptrend line connecting at least two significant swing lows.
Step 2: Identify the most recent significant swing high (the last major peak before the current pullback).
Step 3: Draw Fibonacci retracement from the swing low (the start of the move that produced the swing high) to the swing high.
Step 4: Identify where the trend line and a key Fibonacci level (38.2%, 50%, or 61.8%) will intersect in the near future.
Step 5: Wait for price to pull back toward that intersection zone.
Step 6: Look for a bullish rejection candle as price touches both the Fibonacci level and the trend line simultaneously.
Step 7: Enter long at next candle open. Stop below the trend line (and below the Fibonacci level).
The most powerful confluence: When the 61.8% Fibonacci retracement and the uptrend line intersect at approximately the same price in the near future. This happens naturally during controlled pullbacks in trending markets.
Example:
- EUR/USD uptrend; trend line connecting lows at 1.0800 and 1.0850
- Swing high at 1.0950; swing low at 1.0800 (start of the move)
- 61.8% retracement = 1.0800 + (1.0950-1.0800) × (1-0.618) = 1.0857
- Trend line at the time price would reach 1.0857: also at approximately 1.0857
- Confluence zone: 1.0855–1.0860
Method 2: Fibonacci Level + Horizontal S/R (From Trend Line Break)
When a trend line breaks, the broken trend line becomes a new resistance level. This can then be combined with Fibonacci for a short entry:
Setup:
- Uptrend line breaks (candle closes below the trend line)
- Price bounces back toward the broken trend line (now acting as resistance)
- The retest level coincides with the 38.2%–61.8% Fibonacci retracement of the decline from the break
- A bearish candle forms at the confluence
- Short entry; stop above the retest high
This setup — broken trend line retest + Fibonacci retracement confluence — is one of the most reliable continuation-after-break setups in technical analysis.
Caution When Applying Fibonacci
(This is the content that was previously in the separate “caution-when-trading-fibonacci.md” file.)
The Most Common Fibonacci Mistakes
Drawing from the wrong points: The Fibonacci retracement must be drawn from the most significant swing high to the most significant swing low (or vice versa) of a clearly identifiable move. Drawing from minor, insignificant price points produces random levels that have no market significance.
Forcing a fit: Not every pullback will stop precisely at a Fibonacci level. Some moves will reverse at 45% or 73% — not at a standard Fibonacci ratio. Don’t force an entry when price stalls near a Fibonacci level but doesn’t show clear rejection. Require a confirmation candle.
Using Fibonacci alone: A Fibonacci level without confluence from another method (trend line, round number, moving average, pivot point) is a lower-probability setup. Always require at least one other confirming factor.
Multiple conflicting Fibonacci sets: Some traders draw Fibonacci from multiple timeframes simultaneously and then see so many levels that they can always find one “near” the current price. This defeats the purpose. Identify the single most significant recent swing, draw one Fibonacci set, and trade the key levels from that set.
Tunnel vision on a single level: If price is moving toward the 38.2% but you’re fixated only on the 61.8%, you may miss the actual reversal. Watch all key levels (38.2%, 50%, 61.8%), note the one with the best confluence, and stay flexible.
Combining Both Concepts: The Full Setup
The ideal confluence trade combining Fibonacci and trend lines:
| Condition | Requirement |
|---|---|
| Trend | Clear uptrend or downtrend with a valid trend line (3+ touches) |
| Fibonacci | Drawn from the most significant recent swing; key level (61.8% preferred) approaches the trend line |
| Intersection | The 61.8% Fibonacci and the trend line meet within a 10–20 pip zone |
| Candle confirmation | A rejection candle forms at the intersection zone |
| RSI filter | RSI shows oversold at the zone (for longs) or overbought (for shorts) |
| Entry | Next candle open |
| Stop-loss | Below the zone (trend line + Fibonacci level) + 15-pip buffer |
| Target | Previous swing high (for longs) or 161.8% extension |
When all five conditions align — valid trend line, Fibonacci 61.8%, price at intersection, confirmation candle, and RSI filter — the setup carries strong multi-factor confluence and represents a premium trade opportunity.
Key Takeaways
- Fibonacci retracement and trend lines used together create confluence zones where two independent methods point to the same price, increasing the probability of a meaningful price reaction
- The 61.8% Fibonacci retracement coinciding with an uptrend line touch is the most powerful long-entry confluence in trend following
- Broken trend line retest + Fibonacci retracement is a high-probability continuation setup after a trend line break
- Avoid Fibonacci mistakes: drawing from insignificant points, forcing entries without confirmation, using multiple conflicting Fibonacci sets simultaneously
- Always require at least one additional confirming factor (trend line, round number, MA, pivot) before acting on a Fibonacci level alone
- Mark the expected intersection zone on your chart before price reaches it — pre-planning is more accurate than in-the-moment identification
Related lessons: Fibonacci Retracement | Trading Trend Lines and Channels | Methods to Establish Support and Resistance

Ready to Practice This Strategy?
Test what you learned on a free, risk-free demo account before risking real money.