Chart Patterns: Rectangles, Triangles, Tops and Bottoms in Forex
Rectangles, triangles, and double top/bottom patterns identify consolidation zones and potential breakout directions. Learn to identify each pattern correctly, set valid entry levels, and calculate measured move targets.
Chart patterns are price formations that appear repeatedly in forex markets and carry statistical significance for their likely resolution. Unlike trend indicators that lag price, chart patterns identify potential future moves based on the current price structure.
This lesson covers three foundational pattern families: rectangles (ranging markets), triangles (consolidation before breakout), and tops/bottoms (reversal structures at trend extremes).
Part 1: Rectangle Patterns
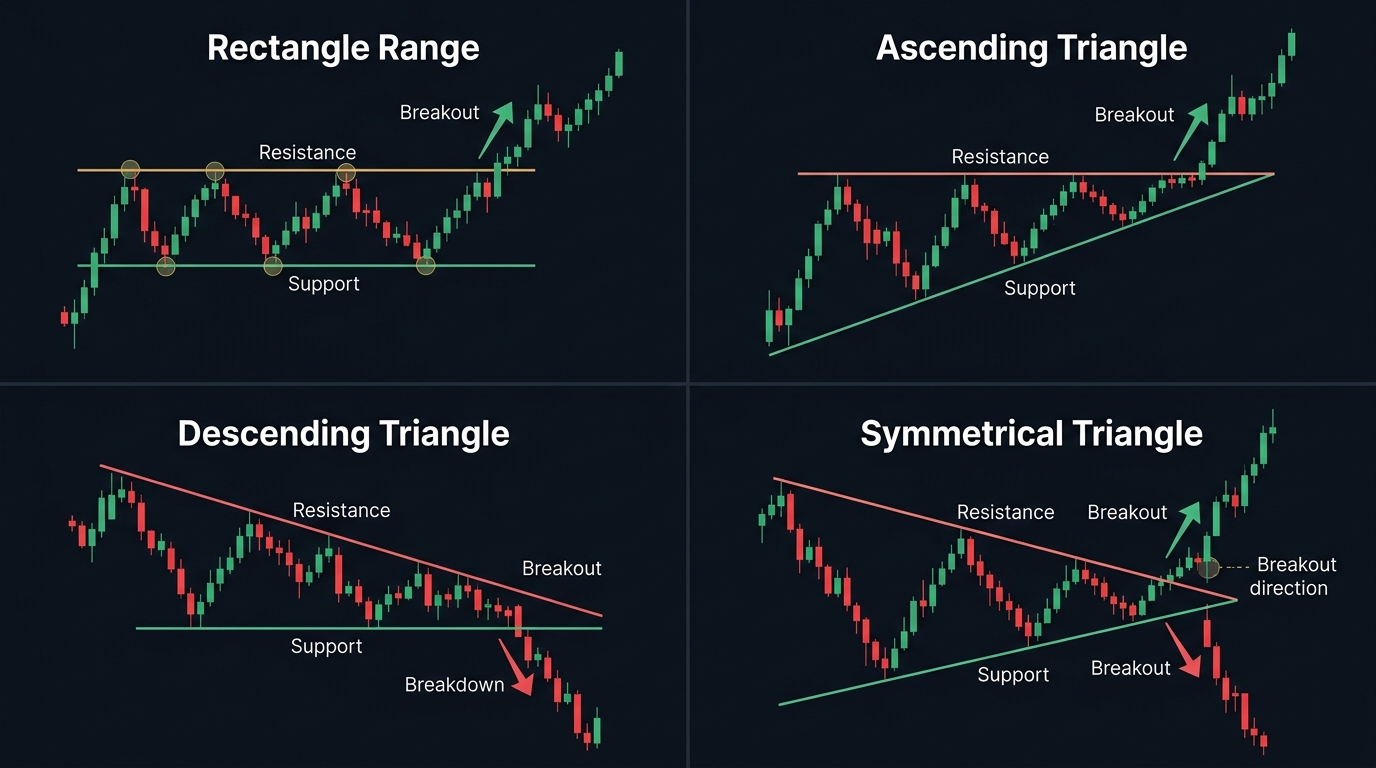
A rectangle pattern forms when price oscillates horizontally between a clear ceiling (resistance) and a clear floor (support), with multiple touches on both sides.
The structure: At least two touches on the upper boundary and two touches on the lower boundary, creating a defined range.
What it represents: Temporary equilibrium — buyers and sellers are balanced. The direction of the eventual breakout reveals which side wins.
Types by context:
| Rectangle Type | Context | Breakout Direction | Reliability |
|---|---|---|---|
| Bullish continuation | Appears mid-uptrend | Upward (with trend) | High |
| Bearish continuation | Appears mid-downtrend | Downward (with trend) | High |
| Reversal rectangle | Appears at trend extreme | Against prior trend | Medium |
Trading the Rectangle
Entry (breakout):
- Wait for price to close a full candle beyond the boundary (not just wick through)
- Enter at the next candle open in the direction of the break
- A retest of the broken boundary before continuing is common — also valid as a secondary entry
Stop-loss: Inside the rectangle (below resistance for a short breakout; above support for a long breakout)
Take-profit (measured move): Project the rectangle’s height beyond the breakout point.
Target = Breakout Level ± Rectangle HeightExample: Rectangle height = 80 pips. Breakout from the upper boundary at 1.1000. Target = 1.1000 + 0.0080 = 1.1080.
False breakout rule: If price breaks out then immediately reverses back inside the rectangle within 2 candles, the breakout is false. Close the trade; the rectangle may continue.
Part 2: Triangle Patterns
Triangles form when price makes progressively smaller swings — either converging toward a point (contracting) or expanding from a point (expanding). The three main types have different directional implications.
Symmetrical Triangle
Structure: Descending highs (upper trendline) and ascending lows (lower trendline) converging to a point.
Implication: No inherent directional bias — price could break either way. Traders wait for the confirmed breakout direction.
Best use: In a trending market, a symmetrical triangle is typically a continuation pattern — the breakout likely occurs in the trend direction. As a standalone pattern in ranging conditions, direction is uncertain.
Entry: Candle close beyond either trendline.
Ascending Triangle
Structure: Flat upper resistance line (price tests the same high repeatedly without breaking) + ascending lower trendline (higher lows forming).
Implication: Bullish. Buyers are consistently more aggressive at higher prices (higher lows), while sellers defend the same level. Eventually buyers overpower the resistance.
Entry: Candle close above the flat resistance line.
Target: Measured move = height of the triangle from the base added to the breakout level.
Descending Triangle
Structure: Flat lower support line + descending upper trendline (lower highs).
Implication: Bearish. Sellers are consistently more aggressive (lower highs), while buyers defend the same level. Eventually the support fails.
Entry: Candle close below the flat support line.
Target: Measured move = height of the triangle subtracted from the breakdown level.
Triangle Comparison Table
| Pattern | Upper Line | Lower Line | Bias | Breakout |
|---|---|---|---|---|
| Symmetrical | Descending | Ascending | Neutral | Either side |
| Ascending | Flat (resistance) | Rising | Bullish | Upward |
| Descending | Falling | Flat (support) | Bearish | Downward |
| Expanding | Rising | Falling | Reversal signal | Both sides tested |
Triangle Timing
A general guideline: breakouts occur within the final 50–75% of the triangle before it closes to its apex. If price reaches the apex without breaking, the pattern has lost its energy — probability decreases.
Part 3: Double Top and Double Bottom
The Double Top and Double Bottom are among the most reliable reversal patterns in forex, appearing at the end of sustained trends.
Double Top (Bearish Reversal)
Structure:
- Price makes a high (first top)
- Price pulls back to a “neckline” support level
- Price rallies again to approximately the same high (second top) but fails to break it
- Price breaks the neckline support
Key requirement: The two tops should be at approximately the same price level (within 2–5%). A significant difference between the two highs weakens the pattern.
Confirmation: The pattern is only confirmed when price closes below the neckline. A wick through the neckline is not confirmation.
Target:
Target = Neckline − (Top Height − Neckline)
= Neckline − Pattern Height
Example: Tops at 1.1250, neckline at 1.1100. Height = 150 pips. Target = 1.1100 − 0.0150 = 1.0950
Double Bottom (Bullish Reversal)
Mirror pattern of the Double Top. Two lows at approximately the same level, separated by a peak. Confirmed on a close above the neckline. Target = neckline + pattern height.
Triple Top / Triple Bottom
The same structure with three tests at the same level instead of two. Slightly more reliable than the double version because three failed attempts to break a level carry more significance than two.
Tops/Bottoms vs. Head and Shoulders
| Feature | Double Top | Head and Shoulders |
|---|---|---|
| Structure | Two equal highs | Three highs (middle highest) |
| Reliability | High | Very High |
| Recognition | Easier | More complex |
| Neckline | Horizontal | Horizontal or slightly angled |
| Measured move | Same formula | Same formula |
Both patterns use the same measured move calculation. The head and shoulders is generally considered more reliable because the three-peak structure provides stronger confirmation of exhaustion.
Risk Management Across All Patterns
| Parameter | Recommendation |
|---|---|
| Risk per trade | 1% of account |
| Entry | Candle close beyond the pattern boundary |
| Stop-loss | Inside the pattern (beyond the most recent swing within the pattern) |
| Take-profit | Measured move projection |
| False breakout exit | If price re-enters the pattern within 2 candles of breakout |
Use the position size calculator for precise lot sizing based on the stop distance.
Key Takeaways
- Rectangles define a horizontal range with multiple touches on each boundary; breakouts (measured move target = range height) occur in the direction of prior trend for continuation rectangles
- Three triangle types: symmetrical (no inherent bias), ascending (bullish — flat resistance + rising lows), descending (bearish — flat support + falling highs)
- Triangle breakouts occur within the final 50–75% of the pattern; breakouts at or after the apex lose significance
- Double Top (bearish) and Double Bottom (bullish) are reversal patterns confirmed only on a close beyond the neckline, not just an intrabar wick
- The measured move rule applies to all: project the pattern’s height beyond the breakout or breakdown level for the minimum target
- Always require a candle close beyond the boundary before entering — many false breakouts produce wicks that quickly reverse without a full candle close
Related: Head and Shoulders | Support and Resistance Levels | Fibonacci Retracement

Ready to Practice This Strategy?
Test what you learned on a free, risk-free demo account before risking real money.