100 EMA and 28 SMA Trading Strategy: Trend Filter with Dynamic Entries
The 100 EMA and 28 SMA combination creates a dual moving average trend system where the 100 EMA defines market direction and the 28 SMA provides dynamic pullback entries. Learn the full setup, rules, and exit framework.
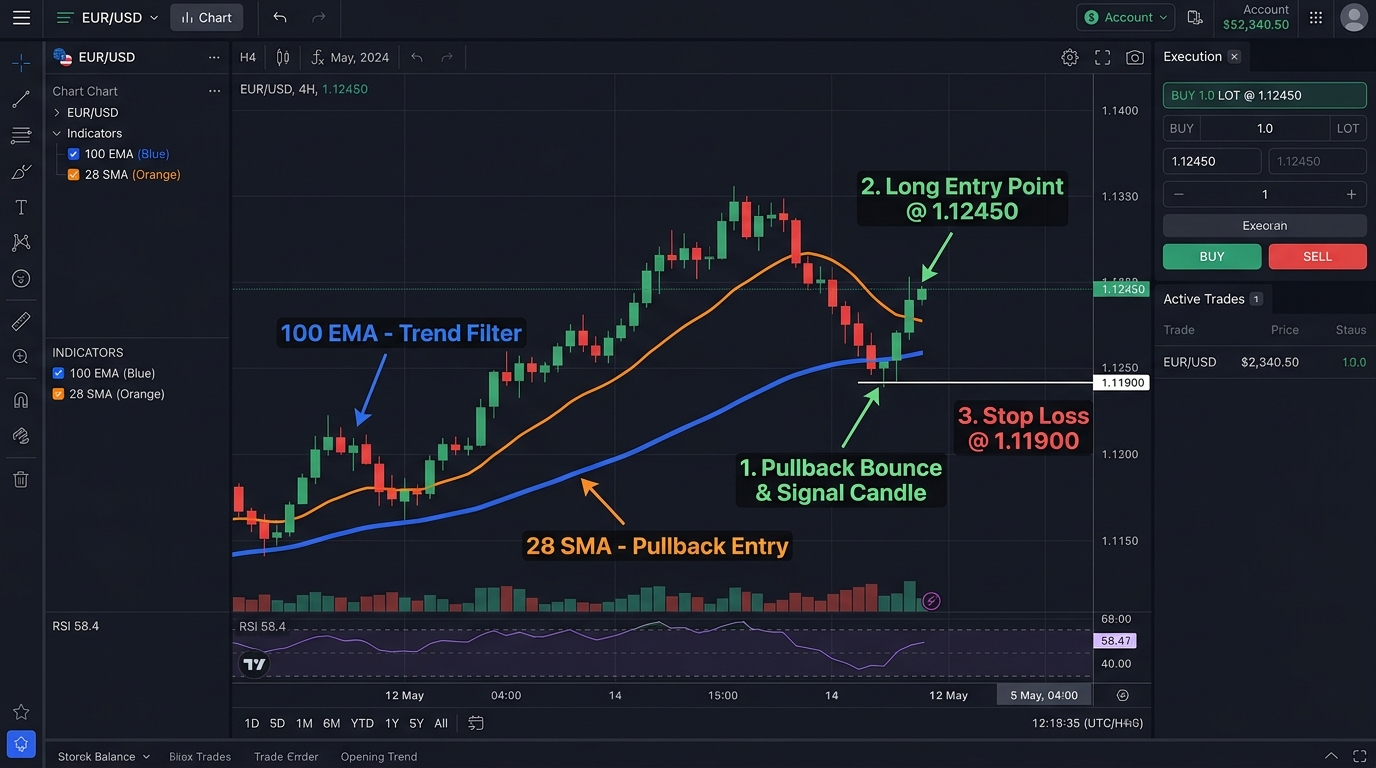
This strategy combines two moving averages with distinct roles: the 100 EMA acts as a directional filter (determining whether to look for longs or shorts only), and the 28 SMA acts as the dynamic support/resistance level for entries.
The logic is straightforward: when the market is trending in one direction above the 100 EMA, you only take entries when price pulls back to the 28 SMA. This prevents counter-trend entries and ensures every trade has the backing of the broader trend.
Indicator Setup
| Indicator | Period | Type | Role |
|---|---|---|---|
| Long-term MA | 100 | EMA | Trend direction filter |
| Entry MA | 28 | SMA | Dynamic S/R entry zone |
Why these specific periods?
The 100 EMA is widely watched by swing and position traders on the 4H and daily charts. It moves slowly enough to define the broader trend while being more responsive than the 200 SMA.
The 28 SMA is less commonly known but provides a natural pullback zone in many trending markets — close enough to price to be useful as an entry signal but not so tight that every small retracement triggers it.
Entry Rules
Long Entry
| Condition | Requirement |
|---|---|
| Trend filter | Price above the 100 EMA on the 4H chart |
| 100 EMA slope | Clearly upward |
| Pullback | Price pulls back and closes at or near the 28 SMA |
| Candle | Bullish rejection candle at the 28 SMA (engulfing, hammer, or pin bar) |
| Entry | Long at next 4H candle open |
| Stop-loss | Below the 28 SMA candle’s low + 15-pip buffer |
| Take-profit | Previous swing high, or 2Г— the stop distance |
Short Entry
| Condition | Requirement |
|---|---|
| Trend filter | Price below the 100 EMA on the 4H chart |
| 100 EMA slope | Clearly downward |
| Pullback | Price rallies back to the 28 SMA |
| Candle | Bearish rejection at the 28 SMA |
| Entry | Short at next 4H candle open |
| Stop-loss | Above the 28 SMA + 15-pip buffer |
| Take-profit | Previous swing low, or 2Г— stop distance |
The 100 EMA as the Absolute Filter
The 100 EMA is a hard filter — no trades are taken against it:
- Price above 100 EMA в†’ longs only; no shorts at the 28 SMA
- Price below 100 EMA в†’ shorts only; no longs at the 28 SMA
- Price crossing the 100 EMA в†’ transition zone; avoid entries; wait for clear positioning above or below
This hard filter eliminates the most common mistake in moving average strategies: entering against the trend because a pullback “looks too good to miss.”
Adding the ADX Filter
Add ADX (14-period) to filter out ranging conditions:
- ADX above 20: Trend is present; take the 28 SMA pullback entry
- ADX below 20: No meaningful trend; the 28 SMA will be crossed repeatedly without following through; skip entries
With the ADX filter in place, the strategy becomes: price above 100 EMA (trend) + ADX above 20 (trending) + pullback to 28 SMA (entry zone) + rejection candle (timing).
Risk Management
| Parameter | Recommendation |
|---|---|
| Risk per trade | 1% of account |
| Stop-loss | Below 28 SMA (long) or above 28 SMA (short) + 15-pip buffer |
| Take-profit | 2:1 RR minimum (2Г— stop distance) |
| Maximum simultaneous trades | 2 |
| Pairs | EUR/USD, GBP/USD, USD/JPY (highest trend clarity) |
When This Strategy Underperforms
Ranging markets: If the 100 EMA is flat (horizontal slope), the pair is ranging. Price will cross the 28 SMA repeatedly without any directional follow-through. The ADX filter eliminates most of this risk.
Transitions: When price is just crossing the 100 EMA, the trend direction is unclear. Avoid entries during these transition periods — wait for price to establish clear positioning (at least 3–5 candles) above or below the 100 EMA before resuming.
Key Takeaways
- The 100 EMA acts as a hard directional filter: only longs when price is above it, only shorts when below; no counter-trend entries
- The 28 SMA provides the dynamic pullback entry zone within the established trend direction
- Add ADX above 20 to confirm that a trend is genuinely present before entering
- Entry requires three elements: trend filter (100 EMA), entry zone (28 SMA), and timing signal (rejection candle)
- The strategy is passive — it doesn’t try to catch every move; it waits for price to return to the 28 SMA within the 100 EMA trend
Related strategies: EMA Crossover and ADX | Three Fast EMA Crossover
Tools: Position Size Calculator
Why the 28 SMA Specifically?
The 28 SMA is not a standard indicator — you’ll rarely see it mentioned in textbooks or widely discussed in forums. Most systems use round numbers: 20, 50, 100, 200. So why 28?
The 28 SMA sits between the 20 and 50 SMA in terms of responsiveness. During strong 4H trends, the 20 SMA is too close to price — it barely provides any pullback to enter. The 50 SMA is too far — by the time price reaches it, the pullback is too deep and often signals trend change rather than continuation.
The 28 SMA consistently finds the middle ground. In a steady 4H uptrend, price typically pulls back 50–80% toward the 28 SMA rather than all the way to the 50 SMA. This makes it a natural entry zone that feels too late for some traders (which is why price bounces there — the traders who waited are entering) but is still in trend territory.
The practical test: apply both the 20 and 28 SMA to historical EUR/USD 4H data. You’ll notice that the 28 SMA catches pullback entries that the 20 SMA misses (price goes past it) while the 50 SMA catches deeper pullbacks that the 28 SMA misses. The 28 sits in a frequently-visited middle zone.
Reading the 100 EMA Slope
The 100 EMA slope matters as much as price’s relationship to it:
Strongly rising 100 EMA: The trend is established and accelerating. Pullbacks to the 28 SMA are high-probability entries.
Gently rising 100 EMA: Trend exists but lacks momentum. Pullbacks to the 28 SMA carry more risk of deeper reversal.
Flat 100 EMA: No trend — skip all entries regardless of price relationship to either MA. This is a ranging environment where both MAs will produce false signals.
Turning 100 EMA (beginning to curve): Potential trend change in progress. Avoid new entries in the previous trend direction; wait for confirmation of the new direction.
A practical rule: if you can place a ruler along the 100 EMA for the past 20 candles and the line is visibly angled upward or downward, the trend is worth following. If the ruler would be nearly horizontal, wait.
Adapting to Daily Chart
The same system logic transfers to the daily chart with adjusted parameters:
| Parameter | 4H Version | Daily Version |
|---|---|---|
| Trend filter | 100 EMA | 100 EMA |
| Entry MA | 28 SMA | 50 SMA |
| Stop buffer | 15 pips | 40–60 pips |
| Expected hold | 1–4 days | 1–3 weeks |
| Signal frequency | 8–15/month | 3–6/month |
On the daily chart, the 28 SMA doesn’t work as well because daily candles cover more ground — price regularly bypasses the 28 SMA entirely. The 50 SMA takes its role on the daily chart as the natural pullback level.
Multi-Pair Application
This system can be run across multiple pairs simultaneously:
Recommended pairs for this system:
- EUR/USD (most liquid; cleanest trend behavior)
- GBP/USD (more volatile; larger moves)
- USD/JPY (particularly effective when BoJ policy divergence creates strong directional trends)
- AUD/USD (trend behavior during risk-on/off cycles)
Maximum simultaneous positions: 2–3 to manage total portfolio exposure. Check currency correlations before adding positions on multiple pairs — EUR/USD and GBP/USD often move together, so holding both long simultaneously concentrates risk.
Key Takeaways Summary
- 100 EMA = hard directional filter (above = longs only; below = shorts only); 28 SMA = dynamic pullback entry zone
- The 28 SMA sits between the 20 and 50 SMA in responsiveness, consistently catching natural pullbacks in 4H trends
- 100 EMA slope matters: strongly angled = high-conviction trend; flat = skip entirely
- Add ADX above 20 to confirm a trend exists before entering any pullback at the 28 SMA
- Entry requires three elements together: 100 EMA direction, pullback to 28 SMA, and a rejection/reversal candle
- The daily chart version replaces the 28 SMA with the 50 SMA as the pullback level
Related strategies: EMA Crossover and ADX | Three Fast EMA Crossover | 50 EMA Rule
Tools: Position Size Calculator
Risk Disclosure & Testing
Past performance of any trading strategy is not indicative of future results. Always backtest and forward test this strategy on a free demo account before committing real financial capital.

Practice This Strategy on a Live Demo
Choose an ECN broker with tight spreads and fast execution for strategy backtesting.