30 SMA Price Action Strategy: Clean Trend Entries Without Indicator Noise
The 30 SMA price action strategy uses the 30-period SMA as a dynamic reference combined with candlestick pattern entries. Learn to trade trend continuations on pullbacks and avoid the false signals that overwhelm indicator-heavy approaches.
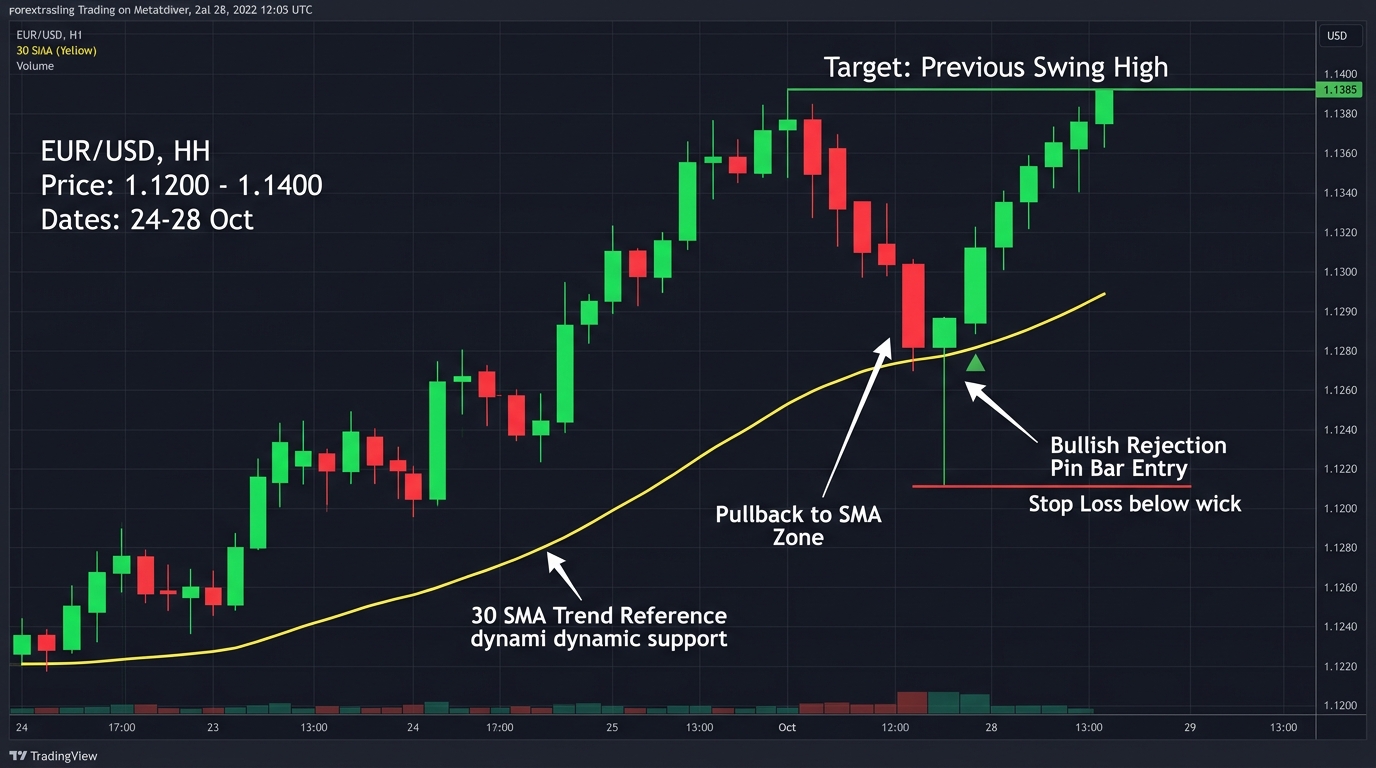
The 30 SMA price action strategy uses a single moving average as a structure reference and relies on candlestick patterns for entry timing. By stripping out additional indicators, it keeps decision-making clean and directly tied to what price is doing.
The 30 SMA is not as commonly discussed as the 50 or 200 SMA, but it offers a useful middle ground: faster than the 50 SMA in tracking shorter trends while avoiding the excessive sensitivity of the 20 EMA. On the 4H chart, it tracks the medium-term trend clearly enough to use as a daily reference.
The Core Concept
The 30 SMA serves one function: Define whether the medium-term trend is up or down.
Price action serves one function: Provide entry timing when price returns to the 30 SMA.
That’s the entire strategy. Two elements, each with a defined role.
Setup Rules
Long Setup
| Condition | Requirement |
|---|---|
| Trend | Price clearly above the 30 SMA on 4H; SMA sloping upward |
| Higher timeframe | Daily trend also bullish (price above daily 50 SMA) |
| Pullback | Price retraces toward the 30 SMA over 3–6 candles |
| Entry signal | Bullish candlestick pattern at or near the 30 SMA |
| Entry | Long at next 4H candle open |
| Stop | Below the lowest wick of the entry candle (or 15 pips below 30 SMA) |
| Target | Previous 4H swing high; or 2× stop distance |
Short Setup
| Condition | Requirement |
|---|---|
| Trend | Price clearly below 30 SMA on 4H; SMA sloping downward |
| Pullback | Price rallies back toward the 30 SMA over 3–6 candles |
| Entry signal | Bearish candlestick at or near the 30 SMA (engulfing, evening star) |
| Entry | Short at next 4H candle open |
| Stop | Above the high of the entry candle |
| Target | Previous 4H swing low |
Valid Entry Candle Patterns
The entry candle (or pattern) appearing at the 30 SMA is the execution signal. It must show clear rejection of the SMA level:
| Pattern | Description | Strength |
|---|---|---|
| Bullish engulfing | Large green body engulfs prior red candle | Strong |
| Hammer | Small body at top; long lower wick below SMA | Strong |
| Tweezer bottoms | Two candles with same or similar lows at SMA | Moderate |
| Morning star | 3-candle reversal pattern at SMA | Very Strong |
| Bullish pin bar | Tiny body; long lower wick; close above SMA | Strong |
For short setups: use the bearish equivalents (bearish engulfing, shooting star, evening star).
Using Price Action Over Indicators
The advantage of removing secondary indicators (RSI, stochastic, etc.) is that entry decisions are based purely on what price is doing, not on a derived mathematical signal that may lag or produce noise.
What to observe instead:
- Volume on the rejection candle: Higher volume at the SMA rejection = more conviction (use tick volume as a proxy if true volume isn’t available)
- Candle body vs. wick ratio: A small body with a large lower wick signals more rejection than a full-bodied candle
- Speed of the pullback: A fast, steep pullback to the SMA is more likely to produce a reversal than a slow, grinding decline (which may signal a trend change)
When This Strategy Fails
Flat 30 SMA: In ranging conditions, the 30 SMA is flat and price crosses it repeatedly. The “pullback to the SMA” entry produces many false signals. Skip the strategy when the 30 SMA has been flat for more than 10–15 consecutive candles.
Deep pullbacks: If price falls significantly through the 30 SMA (more than 50+ pips below on the 4H chart) before any rejection candle appears, the pullback is too deep — the trend may be reversing rather than pulling back.
No price action confirmation: Don’t enter just because price touches the 30 SMA. The confirmation candle is non-negotiable. A touch without rejection is not an entry signal.
Risk Management
| Parameter | Value |
|---|---|
| Risk per trade | 1% of account |
| Stop-loss | Below entry candle low (long) or above (short) |
| Minimum RR | 1:2 |
| Max daily trades | 2 using this system |
| Pairs | EUR/USD, GBP/USD, AUD/USD for cleanest SMA behavior |
Use the position size calculator.
Key Takeaways
- The 30 SMA acts as the trend reference only (not an entry signal by itself) — price above + SMA sloping up = bullish; below + sloping down = bearish
- Entries require both a pullback to the SMA and a confirmed candlestick rejection pattern (engulfing, hammer, pin bar)
- Adding the daily 50 SMA as a higher timeframe filter significantly improves win rate
- Skip when the 30 SMA is flat — no meaningful trend exists and the SMA has no directional value
- Price action (candlestick patterns, wick vs. body ratio, pullback speed) replaces secondary indicators for entry timing
- The simplicity of one-indicator plus price action is intentional: it reduces decision variables and keeps entries directly tied to price behavior
Related strategies: 50 EMA Rule | EMA Crossover and ADX
Related lessons: SMA Explained | Candlestick Charts
Tools: Position Size Calculator
Risk Disclosure & Testing
Past performance of any trading strategy is not indicative of future results. Always backtest and forward test this strategy on a free demo account before committing real financial capital.

Practice This Strategy on a Live Demo
Choose an ECN broker with tight spreads and fast execution for strategy backtesting.