4-Hour Bollinger Band Strategy: Trading the Band Extremes on Intermediate Timeframes
The 4-hour Bollinger Band strategy focuses specifically on band touches, bounces, and breakouts on the 4H chart for swing trade entries. Learn the complete setup, confirmation requirements, and session-specific behavior of Bollinger Bands on the 4H timeframe.
The 4H timeframe is the sweet spot for many swing traders: it captures multi-session directional moves while avoiding the noise of 1H or 15M charts. When Bollinger Bands are applied to the 4H chart, they reflect the volatility of the current intermediate-term trend — wide bands signal active trending; narrow bands signal compression.
This strategy focuses on three specific 4H Bollinger Band setups optimized for swing trading holding periods of 1–5 days.
The 4H Bollinger Band Framework
Settings: 20 SMA, 2 standard deviations (default).
What 4H bands represent: Each band position reflects 4-hour price behavior. The upper band on the 4H chart is approximately where the market is extended relative to the 20-period average — a level that often attracts mean reversion or signals strong momentum.
Key distinction from 1H Bollinger Bands: A touch of the upper 4H band corresponds to a meaningful extended move, not just an intraday spike. The 4H band has more statistical weight because it represents longer-duration price behavior.
Setup 1: 4H Upper Band Resistance Short (Ranging Market)
Condition: ADX below 20 on the 4H chart (ranging, not trending).
| Step | Action |
|---|---|
| 1. Confirm range | 4H ADX below 20; bands roughly parallel |
| 2. Touch | 4H price touches or closes at the upper band |
| 3. Confirmation | A bearish 4H rejection candle at the upper band |
| 4. Entry | Short at next 4H candle open |
| 5. Stop-loss | 20 pips above the upper band at entry |
| 6. Target | 4H middle band (20 SMA), or lower band if momentum continues |
Why it works in ranging markets: In a range, the upper band acts as the ceiling of the price oscillation. The short from the upper band targets the mean (middle band) — a natural reversion that occurs consistently in ranging conditions.
Never use this setup in trending markets: If ADX is above 25 and price is “walking” the upper band (consecutive closes at or above it), this is trend continuation — not a reversal setup. Attempting to short the upper band in a strong uptrend produces consistent losses.
Setup 2: 4H Lower Band Support Long (Ranging Market)
Mirror of Setup 1 with opposite direction:
| Step | Action |
|---|---|
| 1. Confirm range | ADX below 20 |
| 2. Touch | 4H price at lower band |
| 3. Confirmation | Bullish rejection candle |
| 4. Entry | Long at next 4H candle open |
| 5. Stop-loss | 20 pips below the lower band |
| 6. Target | Middle band, then upper band |
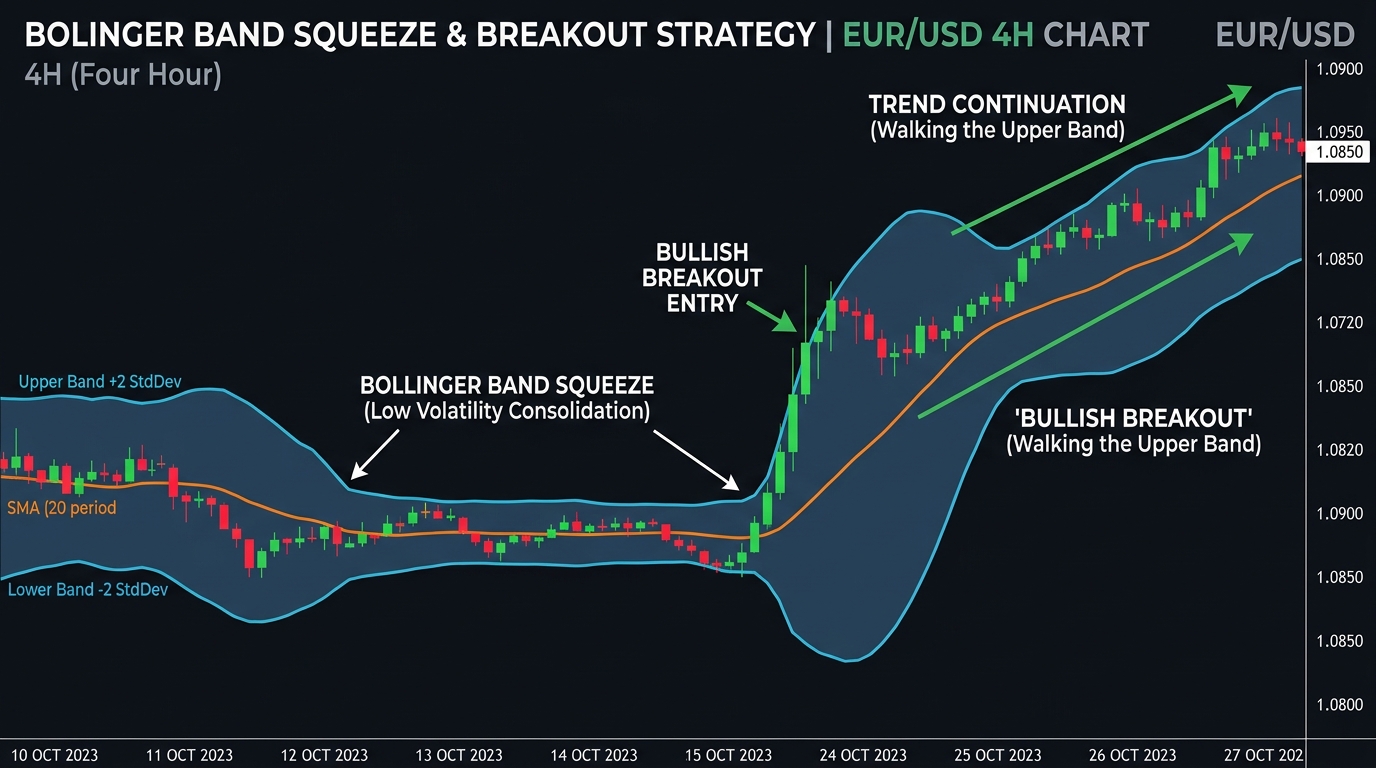
Setup 3: 4H Band Breakout (Trending Market)
Condition: ADX above 20 and rising; market has been in a squeeze (bands narrowing for 5+ 4H candles).
| Step | Action |
|---|---|
| 1. Identify compression | Bands narrowing over 5–10 4H candles; ADX starting to rise from below 20 |
| 2. Watch for break | Price closes beyond upper or lower band on a strong directional candle |
| 3. Confirmation | Second 4H candle also closes beyond the band |
| 4. Entry | Long (upper break) or short (lower break) at opening of the third candle |
| 5. Stop-loss | Opposite band at time of entry |
| 6. Target | 2× band width beyond the breakout point |
The two-candle confirmation prevents the most common false breakout entry: the single spike outside the band that immediately reverses. Waiting for a second close outside the band filters out most false signals.
Session Overlay on 4H Bands
4H candles span sessions — a single 4H candle may cover London open through mid-London, or the London/NY overlap.
Session-specific patterns:
- 4H candle spanning the London/NY overlap (typically 13:00–17:00 GMT): most reliable for directional breaks; highest volume period
- 4H candle spanning Asian session (22:00–02:00 GMT): smallest candles, tightest ranges; band touches in this window are less reliable as reversal signals
- 4H candles in London open window (07:00–11:00 GMT): good for catching early London trends that extend into NY
Practical rule: For setup confirmation, prefer rejection candles appearing during the London (07:00–16:00 GMT) or NY (13:00–22:00 GMT) session portions of the 4H candle.
The 4H Bollinger Band and Daily Trend Alignment
Before any 4H Bollinger Band trade, check the daily chart:
- Daily 20 SMA slope: Up = bullish backdrop (prefer longs at lower 4H band); Down = bearish backdrop (prefer shorts at upper 4H band)
- Daily Bollinger Band status: Is the daily chart itself in a squeeze or trending? This provides context for whether a 4H breakout is likely to be sustained
Highest confidence trades: Daily trend aligns with 4H band signal (e.g., daily uptrend + 4H lower band bounce).
Risk Management
| Parameter | Recommendation |
|---|---|
| Risk per trade | 1% of account |
| Stop-loss | Beyond the opposing band + 20 pip buffer |
| Target for bounces | Middle band (first target) then opposite band |
| Target for breakouts | 2× band width from the breakout candle |
| Maximum hold time | 5 trading days for bounce trades; unlimited for trending breakouts (trail stop to middle band) |
Use the position size calculator.
Key Takeaways
- The 4H Bollinger Band has more statistical weight than 1H bands because each candle represents 4 hours of actual price behavior
- Two setups for ranging conditions (ADX below 20): upper band short and lower band long; target: middle band
- One setup for trending conditions (ADX above 20): band breakout after compression; wait for two consecutive 4H closes outside the band before entering
- Session overlay matters: prefer signals that appear during London or NY session portions of the 4H candle
- Align 4H band signals with the daily chart trend — highest confidence trades occur when daily and 4H frameworks point in the same direction
- Never short the upper band or long the lower band when ADX is above 25 and rising — this is walking-the-band territory, not reversal territory
Related strategies: Bollinger Bands Strategy | Multiple Timeframe Bollinger Bands
Tools: Position Size Calculator
Risk Disclosure & Testing
Past performance of any trading strategy is not indicative of future results. Always backtest and forward test this strategy on a free demo account before committing real financial capital.

Practice This Strategy on a Live Demo
Choose an ECN broker with tight spreads and fast execution for strategy backtesting.