50 EMA Rule: A Clean Single-Indicator Trend Following Method
The 50 EMA Rule is one of the simplest trend-following systems: trade only in the direction of price relative to the 50 EMA, enter on pullbacks to it. Learn the full entry framework, confirmation requirements, and when to avoid it.
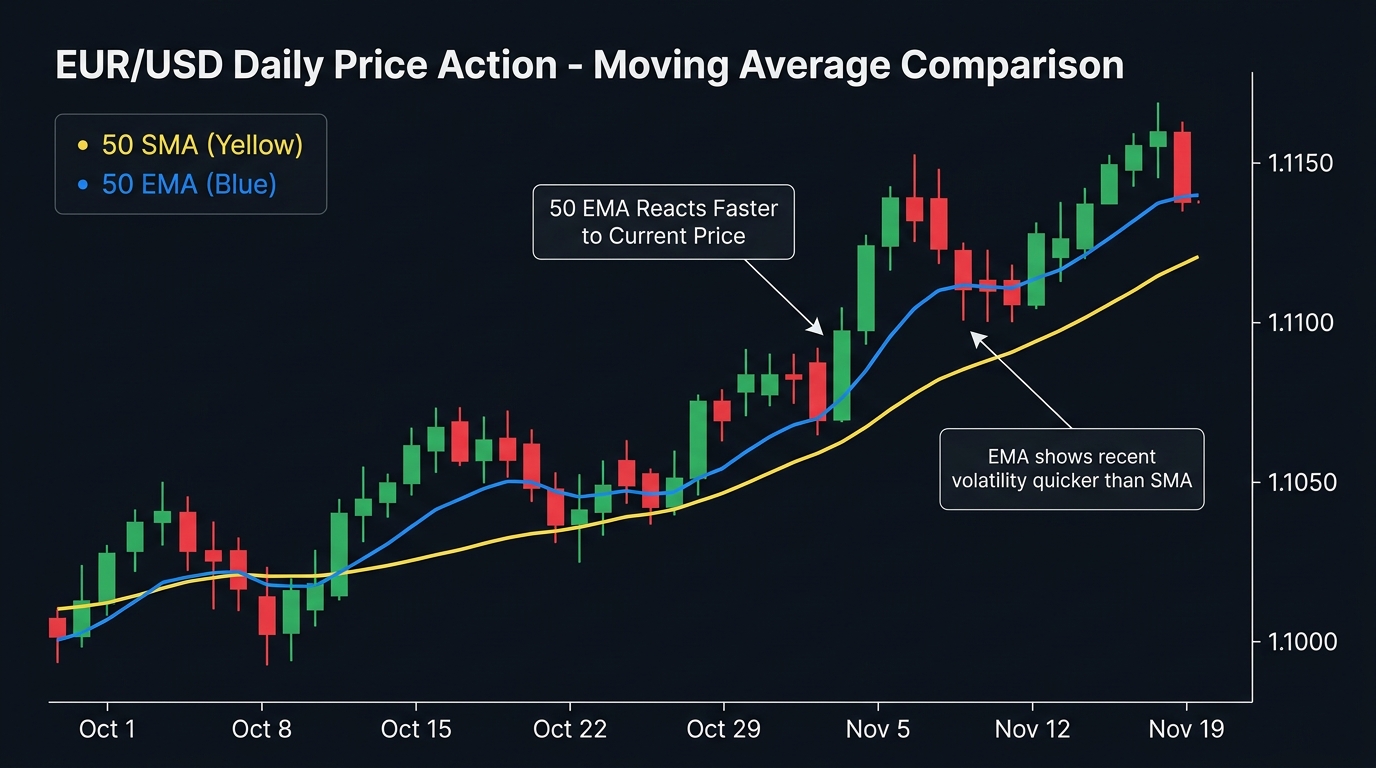
The 50 EMA Rule distills trend-following to its simplest form: one indicator, one rule. Price above the 50 EMA — look for longs. Price below — look for shorts. Entries are taken on pullbacks to the 50 EMA itself.
The elegance of this approach is that the 50 EMA is one of the most widely watched moving averages globally. When price pulls back to the 50 EMA in an established uptrend, it concentrates buy orders from traders who use the same reference. That shared attention is part of why the 50 EMA bounce works.
The Core Rule
Bullish rule: If price is above the 50 EMA on the 4H chart, only take long entries. Do not short, regardless of what shorter-timeframe signals suggest.
Bearish rule: If price is below the 50 EMA on the 4H chart, only take short entries. Do not buy, regardless of how compelling a bounce looks.
Neutral zone: Price crossing the 50 EMA → wait for clear positioning. Don’t trade until price has established itself cleanly above or below.
Entry Framework
Long Entry — Pullback to 50 EMA
| Step | Action |
|---|---|
| 1. Confirm trend | Price above 50 EMA on 4H; 50 EMA sloping upward |
| 2. Wait | Price pulls back toward the 50 EMA |
| 3. Observe | Watch for a bullish rejection candle at the 50 EMA (hammer, bullish engulfing, pin bar) |
| 4. Enter | Long at next 4H candle open after the rejection candle |
| 5. Stop-loss | Below the rejection candle’s low (or 15 pips below the 50 EMA) |
| 6. Take-profit | Previous swing high; or 2× the stop distance |
Short Entry — Pullback to 50 EMA (Downtrend)
Mirror setup: price below 50 EMA, 50 EMA sloping down, price rallies back to the 50 EMA, bearish rejection candle forms, short entry on next candle open.
Required Confirmation: The Rejection Candle
Do not enter on a 50 EMA touch alone. Price regularly crosses through the 50 EMA during choppy periods, immediately reversing and crossing back. Without a clear rejection candle, the probability of a successful bounce is significantly lower.
Valid rejection candles:
- Hammer (long lower wick): Price tested below the 50 EMA then recovered; close near or above the 50 EMA
- Bullish engulfing: Current candle’s body completely engulfs the prior bearish candle; closes above the 50 EMA
- Pin bar: Small body with a long wick pointing away from the 50 EMA (into the area below it)
Invalid: Any candle that closes significantly below the 50 EMA (for a long setup). If the close is below the 50 EMA, the rejection has failed.
Multi-Timeframe Enhancement
Add the daily chart as a second filter:
- Before any 4H entry, check the daily chart’s 50 EMA
- Align the 4H trade direction with the daily 50 EMA position
- If 4H price is above its 50 EMA but daily price is below its 50 EMA: daily downtrend overrides; skip the 4H long
When both the daily and 4H 50 EMAs align (both trending in the same direction and price on the same side of both), entry confidence is highest.
Limitations and When to Skip
| Condition | Action |
|---|---|
| 50 EMA is flat (horizontal) | No trade — market is ranging; 50 EMA provides no directional bias |
| ADX below 20 | Weak or no trend; skip |
| Price cutting back and forth through 50 EMA repeatedly | Choppy; no clear trend; wait |
| Major news event within 2 hours | Reduce size or skip — news can spike through the 50 EMA and immediately reverse |
Risk Management
| Parameter | Recommendation |
|---|---|
| Risk per trade | 1% of account |
| Stop-loss | 15 pips below 50 EMA (long) or above (short); or below rejection candle low |
| Take-profit | 2:1 RR minimum |
| Pairs | EUR/USD, GBP/USD, AUD/USD (trending pairs with clean 50 EMA behavior) |
Use the position size calculator for exact sizing.
Key Takeaways
- One indicator, one rule: price above 50 EMA → longs only; price below → shorts only; no counter-trend entries under any circumstances
- Enter on pullbacks to the 50 EMA, but only with a clear rejection candle (hammer, bullish engulfing, pin bar) — never on a 50 EMA touch alone
- Add the daily chart’s 50 EMA as a secondary filter; when daily and 4H align, conviction is highest
- Skip when the 50 EMA is flat or ADX is below 20 — the 50 EMA has no directional value in ranging conditions
- The 50 EMA’s effectiveness is partially self-reinforcing: because many traders watch this level, real order concentration appears there during trends
Related strategies: 100 EMA and 28 SMA | EMA Crossover and ADX
Tools: Position Size Calculator
Risk Disclosure & Testing
Past performance of any trading strategy is not indicative of future results. Always backtest and forward test this strategy on a free demo account before committing real financial capital.

Practice This Strategy on a Live Demo
Choose an ECN broker with tight spreads and fast execution for strategy backtesting.