Bollinger Bands Strategy: How to Trade Squeezes, Breakouts, and Bounces
Bollinger Bands measure price volatility and identify overbought/oversold conditions relative to recent history. Learn the squeeze, breakout, and walking-the-band setups with complete entry and exit rules.
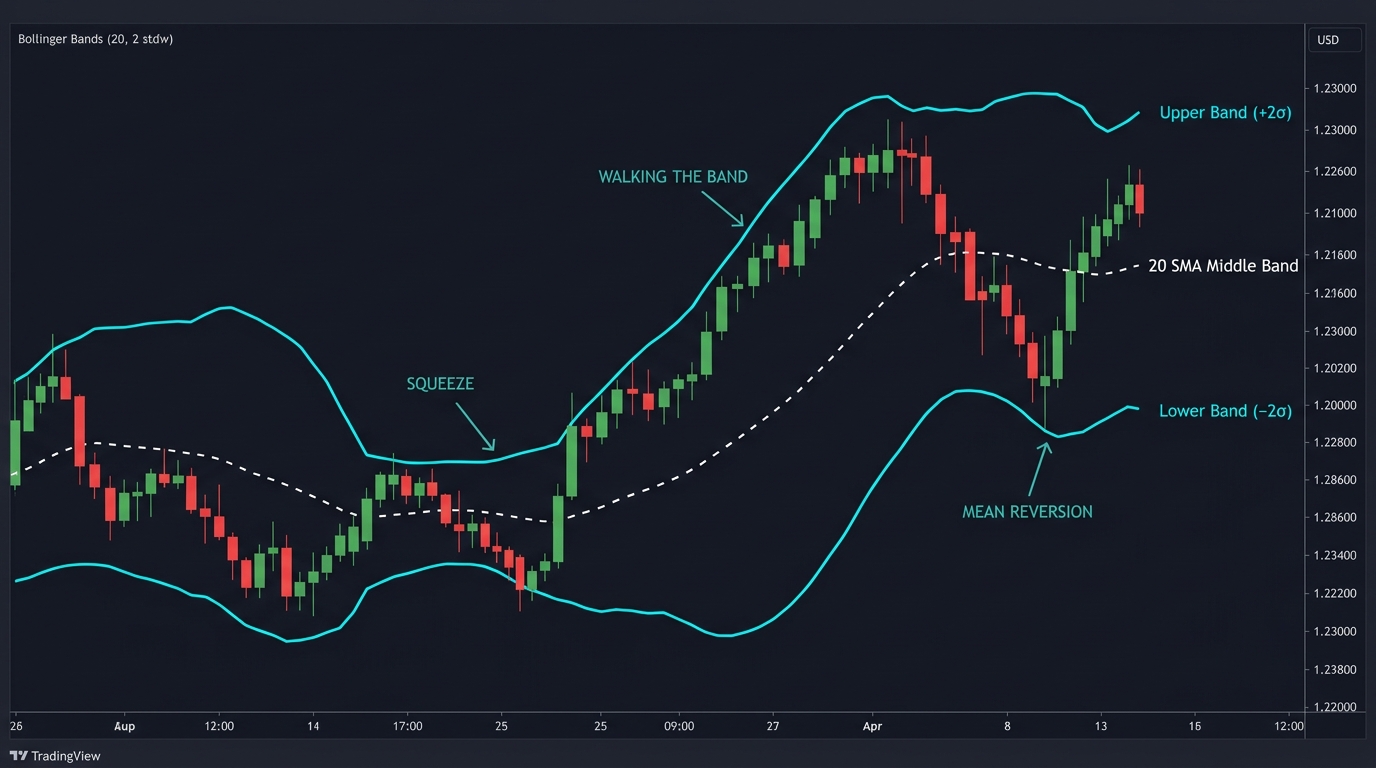
Bollinger Bands do something most indicators can’t: they adapt to the market in real time. When volatility contracts, the bands narrow. When volatility expands, the bands widen. This dynamic property makes them simultaneously useful for identifying ranging conditions, breakout setups, and overbought/oversold reversals.
The three setups that emerge from this — the squeeze, the breakout, and the bounce — serve different market conditions and require distinct entry and exit rules.
What Bollinger Bands Measure
Developed by John Bollinger in the 1980s, Bollinger Bands consist of three lines:
Middle Band: A Simple Moving Average (typically 20-period)
Upper Band: Middle band + 2 standard deviations of price
Lower Band: Middle band − 2 standard deviations of price
Middle Band = 20-period SMA
Upper Band = 20 SMA + (2 × Standard Deviation of price)
Lower Band = 20 SMA - (2 × Standard Deviation of price)
Because standard deviation measures dispersion of price from the mean, the bands naturally expand when prices are moving erratically and contract when prices are stable.
Statistical interpretation: Approximately 95% of price action falls within the two-standard-deviation bands under normal conditions. A close outside the bands represents an unusual event — not an automatic reversal signal, but a notable statistical extreme.
Default settings: 20-period SMA, 2 standard deviations. These work for most trading styles and timeframes.
Setup 1: The Bollinger Band Squeeze (Pre-Breakout)
The squeeze occurs when the bands contract to their narrowest width in recent history. This signals that volatility has compressed — and historically, low volatility precedes high volatility.
The squeeze itself doesn’t tell you which direction the breakout will go. It tells you a significant move is coming.
How to identify the squeeze:
The Bollinger Band Width (BBW) indicator measures the width: (Upper Band - Lower Band) / Middle Band. When BBW reaches its lowest level in 6+ months, a squeeze is forming.
Setup 1 — Squeeze Breakout:
| Step | Action |
|---|---|
| 1. Identify squeeze | Bands visually narrow; BBW at multi-month low |
| 2. Wait for direction | Look for a candle closing beyond the upper or lower band |
| 3. Confirm with momentum | RSI or MACD histogram confirms the directional break |
| 4. Entry | Enter at next candle open in the direction of the breakout |
| 5. Stop-loss | Inside the opposite band at time of entry |
| 6. Take-profit | 2× the band width at breakout (measured from middle band) |
Critical note: The first candle to close outside the band is often a headfake. Wait for a second consecutive candle outside the band before entering. The initial false breakout in the wrong direction is the most common failure mode of squeeze trading.
Setup 2: Bollinger Band Bounce (Mean Reversion)
In ranging markets, price tends to oscillate between the upper and lower bands with the middle band acting as a magnet.
The bounce setup trades from one band back toward the middle band (or the opposite band):
| Step (Long) | Action |
|---|---|
| 1. Confirm range | ADX below 20; bands relatively parallel |
| 2. Wait for touch | Price closes at or below the lower band |
| 3. Confirmation | Bullish rejection candle at or near the lower band |
| 4. Entry | Buy at next candle open |
| 5. Stop-loss | Below the lower band by 10–20 pips |
| 6. Take-profit | Middle band (20 SMA) initially; upper band if momentum continues |
| Step (Short) | Action |
|---|---|
| 1. Confirm range | Same — ADX below 20 |
| 2. Wait for touch | Price closes at or above the upper band |
| 3. Confirmation | Bearish rejection candle |
| 4. Entry | Sell at next candle open |
| 5. Stop-loss | Above the upper band |
| 6. Take-profit | Middle band; lower band if momentum continues |
The bounce setup fails in trending markets. In a strong uptrend, price can “walk” the upper band for extended periods — consecutive closes outside or at the upper band. Attempting to short this as a bounce will produce consistent losses.
Setup 3: Walking the Bands (Trend Continuation)
In a strong trend, price repeatedly touches or closes outside one band while the middle band slopes clearly in the trend direction. This is called walking the bands.
Identification:
- Price closing at or above the upper band for multiple consecutive candles
- 20 SMA clearly sloping upward (uptrend)
- Bands expanding (volatility is increasing with the move)
Trading approach:
- This is a trend continuation signal — stay long, don’t fade
- Use the middle band (20 SMA) as a trailing stop on 4H pullbacks
- Exit when price closes back below the middle band for two consecutive 4H candles
The walking-the-bands pattern is the opposite of the bounce setup. When you see price consistently hugging the upper band, resist the instinct to sell because it “looks overbought.” The data says it’s in a strong trend.
Combining Bollinger Bands With Other Indicators
Bollinger Bands + RSI:
- Bounce setup: Price at lower band AND RSI below 35 → stronger reversal signal
- Walking the bands: Price at upper band AND RSI stays above 50 → trend confirmation
Bollinger Bands + Volume:
- Squeeze breakout on high volume is more reliable than one on thin volume
- A bounce on declining volume (less selling pressure) is more likely to hold
Bollinger Bands + Stochastic:
- Lower band touch + Stochastic oversold (<20) = two independent oversold signals → stronger bounce probability
Settings Adjustment
The default 20/2 settings are the most widely used:
| Setting | Sensitivity | Best For |
|---|---|---|
| 10-period / 1.5 SD | Very tight; many signals, more noise | Scalping |
| 20-period / 2.0 SD (default) | Balanced | Most swing trading |
| 20-period / 2.5 SD | Fewer touches; cleaner signals | Daily charts, position trading |
| 50-period / 2.0 SD | Very slow; major trend confirmation | Weekly analysis |
Increasing the standard deviation from 2.0 to 2.5 captures less frequent but higher-significance band touches. Price closing outside a 2.5 SD band is a more unusual event than outside a 2.0 SD band.
Risk Management
| Parameter | Recommendation |
|---|---|
| Risk per trade | 1% of account |
| Stop-loss | Beyond the relevant band (15–20 pip buffer) |
| Minimum RR | 1:2 for bounces; variable for breakouts (capture the move) |
| Avoid | Trading squeeze breakouts on thin liquidity sessions |
Use the position size calculator for exact lot sizing.
Key Takeaways
- Bollinger Bands (20 SMA ± 2 standard deviations) adapt to volatility — narrow bands signal compression; wide bands signal expansion
- Three setups: squeeze breakout (low volatility → directional move), bounce (range trading at band extremes), walking the bands (trend confirmation — don’t fade)
- The squeeze identifies when a move is coming, not which direction — wait for a confirmed directional candle close (ideally two) before entering
- Bounce setups require ADX below 20 and candlestick confirmation at the band — never enter on a band touch alone in a trending market
- Walking the bands signals a strong trend — the 20 SMA is the trailing stop in this context, not a reversal zone
- Combine with RSI or Stochastic for higher-probability bounce entries; with volume for stronger squeeze breakout confirmation
Related strategies: RSI Strategy | Stochastic High Low
Related lessons: Moving Averages
Tools: Position Size Calculator
Risk Disclosure & Testing
Past performance of any trading strategy is not indicative of future results. Always backtest and forward test this strategy on a free demo account before committing real financial capital.

Practice This Strategy on a Live Demo
Choose an ECN broker with tight spreads and fast execution for strategy backtesting.