Candlestick Simple System: Trading Reversals With Engulfing and Pin Bar Patterns
The candlestick simple system uses two high-probability reversal patterns — bullish/bearish engulfing and pin bars — as standalone entry signals at key technical levels. Learn the complete rules, target calculation, and filter requirements.
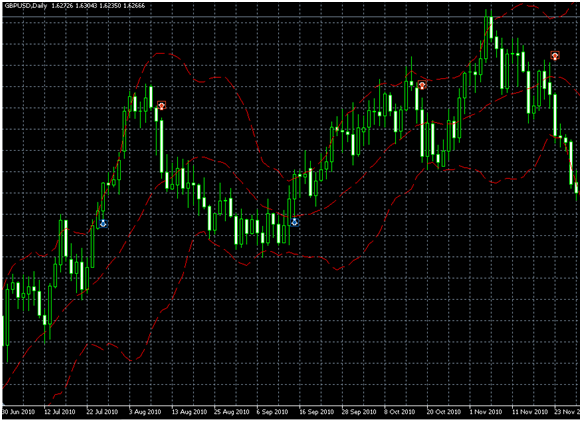
Candlestick patterns at key technical levels are among the most durable signals in technical trading. They don’t require indicators. They don’t require complex mathematical formulas. They require only a clear understanding of what the candle shapes mean and the discipline to enter only when the context is right.
This system uses two patterns — the engulfing candle and the pin bar — at defined support and resistance levels.
The Two Patterns
Bullish Engulfing Candle
Structure: A two-candle pattern where the second (bullish) candle’s body completely engulfs the first (bearish) candle’s body. The second candle opens lower and closes higher than the first candle’s entire range.
What it signals: Sellers controlled the prior session; buyers overwhelmed them in the current session. The momentum shift is visible in the candle’s structure.
Requirements for validity:
- The engulfing candle must close above the prior candle’s open (not just its close)
- Occurs at a key support level (swing low, Fibonacci zone, S/R level, round number)
- The engulfing candle’s volume (tick volume) should be higher than the prior candle’s volume
Bearish Engulfing: The mirror pattern — bullish candle followed by a larger bearish candle that engulfs it, at a resistance level.
Pin Bar (Hammer / Shooting Star)
Structure: A single candle with a small body (open and close close together) and a disproportionately long wick pointing away from the level being tested.
Bullish Pin Bar (Hammer):
- Long lower wick: 2Г— or more the length of the body
- Small body near the top of the candle
- Lower wick penetrates below the support level being tested
- Candle closes above the support level
What it signals: Price tested below the support level during the candle period, found strong rejection, and closed back above. Sellers tried and failed.
Bearish Pin Bar (Shooting Star):
- Long upper wick penetrates above resistance
- Small body at the bottom
- Closes below the resistance level
Entry Framework
Long Entry (Engulfing or Pin Bar)
| Step | Action |
|---|---|
| 1. Identify the level | Significant support: swing low, Fibonacci zone, round number, MA |
| 2. Wait | Price approaches the support level |
| 3. Confirm pattern | Bullish engulfing OR bullish pin bar forms at the level |
| 4. Trend check | Is the higher timeframe trend up? (Preferred, not mandatory for counter-trend setups) |
| 5. Entry | Long at next 4H candle open after the pattern candle |
| 6. Stop-loss | Below the pattern’s lowest wick + 10-pip buffer |
| 7. Take-profit | Next significant resistance level (swing high, Fibonacci extension) |
Short Entry
Mirror conditions: bearish engulfing or bearish pin bar (shooting star) at a resistance level. Stop above the pattern’s highest wick.
The Context Requirement
The most critical filter: the pattern must appear at a significant level. A bullish engulfing candle in the middle of an empty chart with no S/R nearby has very low probability. The same pattern at a tested support zone has meaningfully higher probability.
Valid context levels (strongest to weakest):
| Context | Why It’s Significant |
|---|---|
| Strong swing low/high (3+ prior tests) | Major order concentration |
| 61.8% Fibonacci retracement | Widely watched by institutional traders |
| Daily or weekly pivot S1/R1 | Global reference level |
| 50 SMA or 200 SMA (daily) | Institutional moving average |
| Round number (00 or 50 figure) | High order concentration |
A pattern at a level with 2–3 of these factors simultaneously (e.g., swing low + 61.8% Fibonacci + round number) is a high-conviction entry.
Trend Alignment
Best scenario: The pattern appears at support in an established uptrend. The trade aligns with the dominant trend; the pattern captures the continuation from a pullback low.
Also valid: Counter-trend patterns (e.g., bearish pin bar at resistance during an uptrend) — but require stronger pattern quality and confluence to justify trading against the trend.
Skip: Patterns in the middle of a defined range without a clear trend context. The signal needs a directional framework to work within.
Risk Management
| Parameter | Value |
|---|---|
| Risk per trade | 1% of account |
| Stop-loss | Below pattern low (long) + 10 pip buffer |
| Take-profit | Next significant S/R level |
| Minimum RR | 1:2 (skip if the nearest resistance doesn’t provide at least 2Г— the stop distance) |
The RR check is mandatory before entry: If the nearest resistance is only 20 pips away and your stop requires 25 pips, the math doesn’t work. Either find a tighter entry or skip the trade.
Use the position size calculator.
Key Takeaways
- Two patterns: bullish/bearish engulfing (two-candle momentum shift) and pin bar (single-candle rejection with long wick)
- Context is the primary filter: patterns at significant levels (swing points, Fibonacci, round numbers, key MAs) have meaningfully higher probability than patterns in empty chart areas
- Long entry: next candle open after the pattern; stop below pattern’s lowest wick + buffer; target: next resistance
- Always check RR before entering: the nearest target must provide at least 2:1 compared to the stop distance
- Trend alignment improves probability: patterns in the direction of the higher-timeframe trend outperform counter-trend patterns
- No indicators required — the strategy runs on price structure and candlestick reading alone
Related lessons: Candlestick Charts | Support and Resistance Levels
Related strategies: 30 SMA Price Action
Tools: Position Size Calculator
Risk Disclosure & Testing
Past performance of any trading strategy is not indicative of future results. Always backtest and forward test this strategy on a free demo account before committing real financial capital.

Practice This Strategy on a Live Demo
Choose an ECN broker with tight spreads and fast execution for strategy backtesting.