EMA Breakthrough Strategy: Trading Momentum Breakouts Through the EMA
The EMA breakthrough strategy enters when price decisively breaks through a key EMA with strong momentum, rather than waiting for a pullback. Learn the setup conditions, volume confirmation, and why this differs from the standard EMA bounce approach.
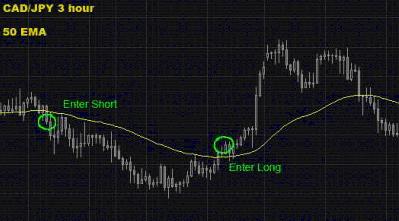
Most EMA-based trading strategies focus on the pullback — waiting for price to return to the EMA in an established trend and entering the bounce. The EMA breakthrough strategy is different: it enters at the moment price breaks through a key EMA decisively, signaling that a new trend is establishing.
The logic: when price breaks through a major EMA (50 or 200) with strong momentum, it represents a shift in the balance of power between buyers and sellers. Early entry at the breakthrough captures the initial momentum of the new trend.
The Key Distinction
EMA Bounce strategy: Price is above the EMA (uptrend). Price pulls back to the EMA. Enter long on the bounce. The EMA acts as support.
EMA Breakthrough strategy: Price is below the EMA (downtrend). Price approaches the EMA from below. Price breaks through decisively and closes above the EMA. Enter long — the EMA has shifted from resistance to new support.
Setup Requirements
Bullish Breakthrough (Downtrend в†’ Uptrend Transition)
| Condition | Requirement |
|---|---|
| Context | Price has been below the 50 EMA (or 200 EMA) for at least 10+ candles |
| Approach | Price approaches the EMA from below |
| Break | 4H candle closes above the EMA by at least 15 pips (not just a wick through) |
| Momentum | The breakout candle is larger than the average recent candle (strong body, minimal wicks) |
| Volume (tick volume) | Breakout candle’s tick volume is above the 10-candle average |
| Entry | Long at the next 4H candle open |
| Stop-loss | Below the breakout candle’s low |
| Take-profit | 2Г— stop distance, or next key resistance level |
Bearish Breakthrough (Uptrend в†’ Downtrend Transition)
| Condition | Requirement |
|---|---|
| Context | Price has been above 50 EMA for 10+ candles |
| Break | 4H candle closes below EMA by 15+ pips |
| Momentum | Large bearish body; above-average tick volume |
| Entry | Short at next 4H candle open |
| Stop | Above the breakout candle’s high |
| Take-profit | 2Г— stop distance |
The Retest Entry (Lower Risk Alternative)
The breakthrough entry captures the early move but carries higher risk because:
- The initial breakout may be a false break
- Entry at the breakout candle open may be at a poor price relative to the move’s potential
The retest approach: After the breakthrough, wait for price to pull back and retest the EMA (which is now support, having previously been resistance):
- Price breaks above 50 EMA (bullish)
- Price continues upward for 3–5 candles
- Price pulls back to retest the 50 EMA from above
- A rejection candle forms at the 50 EMA (now acting as support)
- Enter long at the next candle open
This is lower risk (tighter stop; better-defined S/R) but may miss the move if price doesn’t pull back.
EMA Size Matters
Stronger breakthrough signals come from larger EMAs:
| EMA | Signal Significance |
|---|---|
| 20 EMA | Minor breakthrough; frequent false breaks |
| 50 EMA | Moderate significance; worth watching |
| 200 EMA | Major breakthrough; rare but very significant |
A daily chart price closing above the 200 EMA after an extended period below it is a major signal that attracts institutional attention and produces substantial moves. These are rare but among the most reliable breakthrough setups.
Risk Management
| Parameter | Value |
|---|---|
| Risk per trade | 1% of account |
| Stop | Below the breakthrough candle’s low (long) |
| Target | 2:1 RR minimum; or next major resistance |
| Required close | 15 pips beyond the EMA (not a wick) |
| ADX note | ADX beginning to rise from low levels is additional confirmation of new trend emerging |
Use the position size calculator.
Key Takeaways
- EMA breakthrough enters when price breaks through a key EMA (50 or 200) with conviction — the opposite approach from the standard EMA bounce/pullback entry
- Requirements: 4H close beyond EMA by 15+ pips (not just a wick), large momentum candle, above-average tick volume
- The larger the EMA (200 > 50 > 20), the more significant the breakthrough signal
- Lower-risk alternative: enter on the retest of the broken EMA (now acting as new support/resistance) rather than the initial breakout
- Daily 200 EMA breakthroughs are rare but among the strongest trend-change signals available in technical analysis
- Add ADX as context: rising ADX from a low level confirms that a new trend is actually emerging, not just a temporary spike through the EMA
Related strategies: 50 EMA Rule | EMA Crossover and ADX
Related lessons: EMA Explained | SMA Explained
Tools: Position Size Calculator
Filtering False Breakouts
The EMA breakthrough strategy’s most common failure mode is the false breakout: price closes beyond the EMA, you enter, then price reverses and closes back inside the prior range. Several filters reduce this risk:
Candle body requirement. Require the breakout candle’s body (not wick) to close beyond the EMA by at least 15 pips. A wick poking through doesn’t qualify — the candle must close with its body beyond the line.
Second candle confirmation. Instead of entering immediately on the breakout candle’s close, wait for the next candle to also close beyond the EMA. This costs you some entry price but eliminates many false breaks that reverse within 1–2 candles.
Volume spike check. On MT4/MT5, the volume indicator shows tick volume (not actual traded volume, but still a useful proxy). A breakout candle with tick volume at least 50% above the 20-candle average is more likely to represent genuine institutional participation.
Session filter. The most reliable EMA breakouts occur during the London or New York sessions. Breakouts during the Asian session (particularly on EUR/USD) frequently fail when European participants arrive with a different bias.
EMA Breakthrough vs. EMA Bounce
These two approaches are conceptually opposite and should not be confused:
| Approach | Entry Trigger | Entry Direction | Best In |
|---|---|---|---|
| EMA Bounce | Price touches EMA from established side | WITH the existing trend | Established trends |
| EMA Breakthrough | Price closes THROUGH the EMA | AGAINST the previous direction | Trend changes |
The 50 EMA Rule strategy uses the bounce approach — it enters when price pulls back to the EMA and bounces in the established trend direction. The breakthrough strategy does the opposite: it enters when price breaks through the EMA as evidence that the trend may be changing.
Both are valid; they apply in different market phases. The breakthrough setup is rarer and typically higher-reward (catching a trend change) but also higher-risk (more false signals).
Historical Significance of the 200 EMA
The 200 EMA on the daily chart carries special significance in financial markets because it’s widely used as the institutional benchmark for bull vs. bear markets:
- Price consistently above daily 200 EMA = broad bull market
- Price consistently below daily 200 EMA = broad bear market
When a major pair like EUR/USD breaks above its daily 200 EMA after an extended period below it, the event attracts coverage from major financial outlets and generates attention from both retail and institutional participants. This media and institutional attention can create additional momentum following the breakout.
Similarly, breaking below the daily 200 EMA generates bearish commentary that can amplify the sell-off. For the breakthrough trader, these 200 EMA events on the daily chart are among the most significant setups available.
Practical Trade Example Framework
For a bullish 50 EMA breakthrough on a 4H chart:
- Pre-signal: Price has been consistently below the 50 EMA for at least 10–15 candles
- Signal candle: A bullish 4H candle closes above the 50 EMA with its body 15+ pips above the line
- Confirmation (optional): The following 4H candle also closes above the 50 EMA
- Entry: Long at the open of the first candle after the signal (or confirmation if you waited)
- Stop: Below the signal candle’s low
- Target: 2x the stop distance, or next major resistance level
- Management: If price pulls back to the 50 EMA after the breakout and holds above it, the EMA is now acting as support — that retest is a second entry opportunity with a tighter stop
Key Takeaways Summary
- EMA breakthrough enters when price breaks through a key EMA — the opposite approach from EMA bounce/pullback strategies
- Requirements: 4H close beyond EMA by 15+ pips (body, not wick), momentum candle, above-average volume
- Filter false breakouts: candle body rule, second candle confirmation, session filter (prefer London/NY sessions)
- Larger EMAs (200 > 50 > 20) produce more significant breakthrough signals; daily 200 EMA breaks are the highest-conviction events
- EMA breakthrough targets trend changes; EMA bounce trades trend continuations — know which phase you’re in
- The retest of the broken EMA (now acting as support/resistance) provides a second, lower-risk entry on valid breakthroughs
Risk Disclosure & Testing
Past performance of any trading strategy is not indicative of future results. Always backtest and forward test this strategy on a free demo account before committing real financial capital.

Practice This Strategy on a Live Demo
Choose an ECN broker with tight spreads and fast execution for strategy backtesting.