EMA Crossover and ADX Strategy: A Complete Trend-Following System
The EMA crossover filtered by ADX combines trend direction and trend strength into one consistent system. Learn the full rules, pair selection, timeframes, and examples of how this setup performs in 2026.
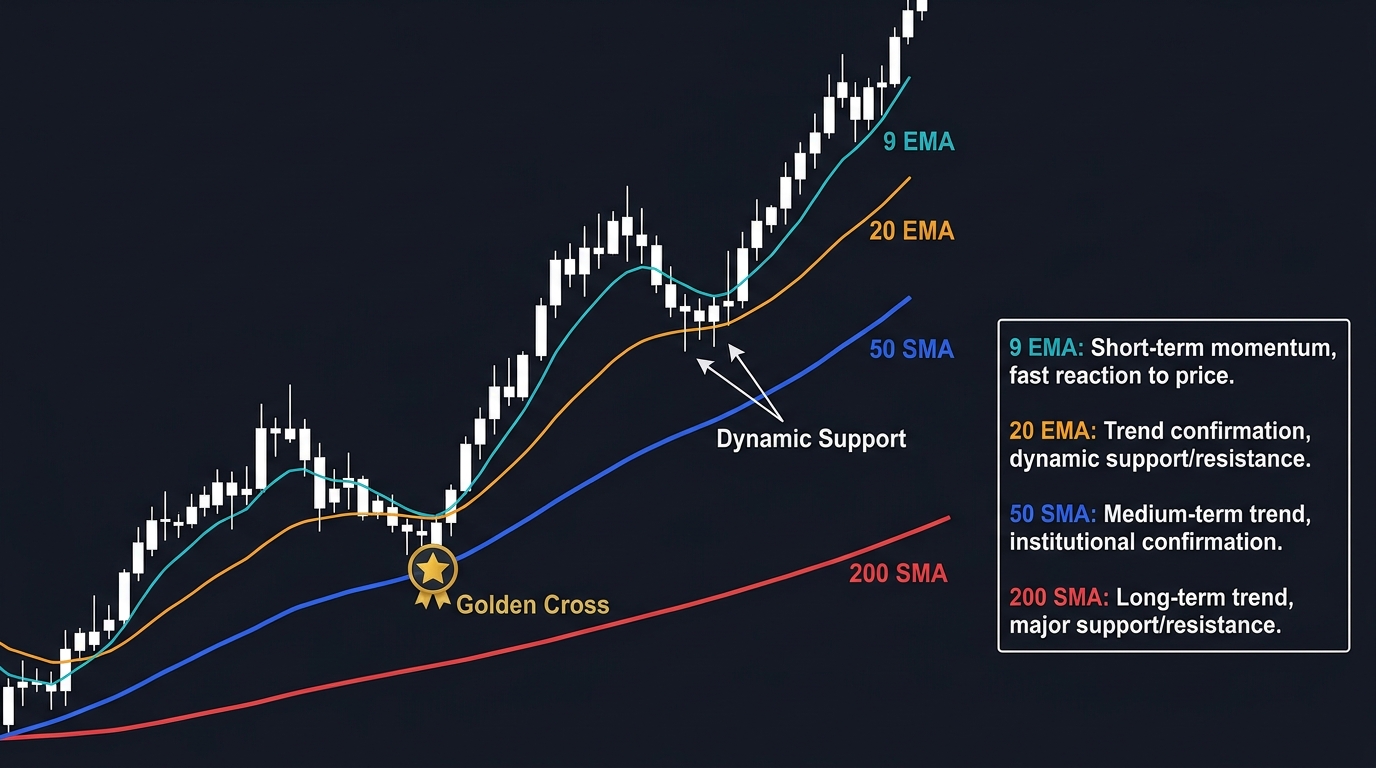
The EMA crossover is simple. The ADX is simple. Together, they solve each other’s biggest weakness.
The EMA crossover generates too many false signals in ranging markets — it “whipsaws” as price oscillates around the moving averages without trending anywhere. The ADX identifies when a trend is strong enough to trade but doesn’t tell you direction. Combine them and you get a system with built-in trend qualification: entry signals only when the market is actually trending.
The Logic
EMA crossover generates directional signals: when the fast EMA crosses above the slow EMA, momentum is shifting bullish. Below — bearish.
ADX measures trend strength regardless of direction. Above 25 means a trend is in place. Below 20 means the market is ranging. The ADX qualification filter eliminates the most common failure condition for EMA crossover systems.
Combined rule: Only act on an EMA crossover when ADX is simultaneously above 25. If ADX is below 20, crossovers are noise — ignore them completely.
System Settings
| Parameter | Value |
|---|---|
| Fast EMA | 9-period |
| Slow EMA | 21-period |
| ADX period | 14 |
| ADX trend threshold | 25 |
| Trading timeframe | 4H (primary) or 1H |
| Higher timeframe filter | Daily chart — direction only |
| Best pairs | EUR/USD, GBP/USD, USD/JPY |
Entry Rules
Long Entry (All Conditions Must Be Met)
| Condition | Requirement |
|---|---|
| 1. Higher TF trend | Daily chart: price above 50 SMA (uptrend context) |
| 2. Crossover | 9 EMA crosses above 21 EMA on 4H chart |
| 3. ADX | ADX (14) is above 25 at time of crossover |
| 4. ADX direction | ADX line is rising (trend strengthening, not weakening) |
| 5. Candle close | Wait for the 4H candle to close with the crossover in place |
| 6. Entry | Market order at the open of the next 4H candle |
Short Entry (All Conditions Must Be Met)
| Condition | Requirement |
|---|---|
| 1. Higher TF trend | Daily chart: price below 50 SMA (downtrend context) |
| 2. Crossover | 9 EMA crosses below 21 EMA on 4H chart |
| 3. ADX | ADX (14) above 25 |
| 4. ADX direction | ADX rising |
| 5. Candle close | Wait for 4H close |
| 6. Entry | Market order at next 4H candle open |
Exit Rules
Exit — Stop-Loss
Place the stop-loss beyond the most recent swing point on the 4H chart:
- Long: Below the lowest wick of the last significant swing low before entry
- Short: Above the highest wick of the last significant swing high before entry
Alternative (ATR-based): Use 1.5× ATR(14) on the 4H chart as the stop distance. This adapts to current volatility.
Minimum stop distance: 25 pips on EUR/USD. If structure-based stop is tighter than 25 pips, skip the trade or use the 25-pip minimum.
Exit — Take-Profit
Method 1 — Fixed RR: Target 2× the stop-loss distance. Simple and consistent.
Method 2 — Trailing stop: Once the trade is 1× risk in profit, move stop to breakeven. Then use the 21 EMA as a trailing stop — close the trade when price closes below the 21 EMA (long) or above it (short) for two consecutive 4H candles.
Method 2 typically captures more of strong trends. Method 1 is better in volatile, choppy conditions where trailing stops get triggered prematurely.
Exit — System Exit (Close on Reverse Crossover)
Close the position if the 9 EMA crosses back through the 21 EMA in the opposite direction AND the ADX remains above 20 (trend reversal signal). If ADX has dropped below 20, the cross is likely noise — don’t reverse, but consider tightening the stop.
Risk Management
| Parameter | Value |
|---|---|
| Risk per trade | 1% of account |
| Max open trades simultaneously | 2 |
| Max correlated exposure | If EUR/USD and GBP/USD both long, combined risk ≤ 2% |
| Avoid | Trading within 30 minutes of high-impact news events |
| Avoid | Trades where daily and 4H trend direction conflict |
Use the position size calculator to calculate exact lots based on your stop-loss distance.
Trade Filtering: When NOT to Take the Signal
Even valid crossovers should be skipped in specific conditions:
| Condition to Avoid | Reason |
|---|---|
| ADX below 20 | Market is ranging; crossover is noise |
| ADX above 25 but declining sharply | Trend may be exhausting; higher reversal risk |
| Crossover occurs within 10 pips of key S/R level | Price may reverse at the level before the trade develops |
| Major news event within 2 hours | Volatility spike can trigger premature stop |
| Daily and 4H trends conflict | Trade has weaker statistical support |
Performance Characteristics
This system’s statistical profile in backtesting across major pairs (2020–2026):
| Metric | Expected Range |
|---|---|
| Win rate | 45–55% |
| Average RR (if using fixed 1:2) | 2.0 |
| Expected value per trade | +0.2 to +0.5 risk units |
| Average trade duration | 2–5 days |
| Drawdown periods | Primarily during ranging markets (Q3/Q4 typical low-volatility) |
This system performs best during trending market regimes (2022 rate hike cycle, 2024 JPY weakness, Q1 2026). It underperforms during low-volatility consolidation periods. Tracking market regime (via ADX on weekly chart) helps calibrate expectations.
Example: GBP/USD 4H, November 2024
Market context: GBP/USD had been declining since late October. Daily 50 SMA pointing down. ADX on weekly chart: 32 (strong trend).
Signal:
- 9 EMA crosses below 21 EMA on 4H chart: November 7
- ADX(14) at crossover: 31 (above threshold, rising)
- Daily chart confirms downtrend (price below daily 50 SMA)
- Entry: Short at 1.2785 (open of next 4H candle)
Trade management:
- Stop-loss: Above last swing high at 1.2865 (80 pips)
- Take-profit (1:2 RR): 1.2625 (160 pips)
- Trailing: After 80 pips profit, moved stop to breakeven
Outcome: Price reached 1.2620 over the next 8 days. Target hit. Result: +160 pips / +2.0R
Key Takeaways
- The EMA crossover + ADX system only generates entry signals when both direction (crossover) and trend strength (ADX >25) are confirmed simultaneously
- All four conditions must be present: daily trend alignment, 4H crossover direction, ADX above 25, ADX rising
- Stop-loss based on last swing structure or 1.5× ATR; take-profit at 2× risk or trail using the 21 EMA as a guide
- Skip crossovers when ADX is below 20, declining sharply, or when major news is imminent
- Win rate is 45–55%; the edge comes from the positive RR (1:2 minimum), not from high accuracy
- The system underperforms in ranging low-volatility conditions — track weekly ADX as a regime filter
Related strategies: Moving Averages Crossover | Three Fast EMA Crossover
Related lessons: Moving Averages | Trend Indicators
Tools: Position Size Calculator
Risk Disclosure & Testing
Past performance of any trading strategy is not indicative of future results. Always backtest and forward test this strategy on a free demo account before committing real financial capital.

Practice This Strategy on a Live Demo
Choose an ECN broker with tight spreads and fast execution for strategy backtesting.